USD/NOK faces a steep decline after Norges Bank and Fed’s decision

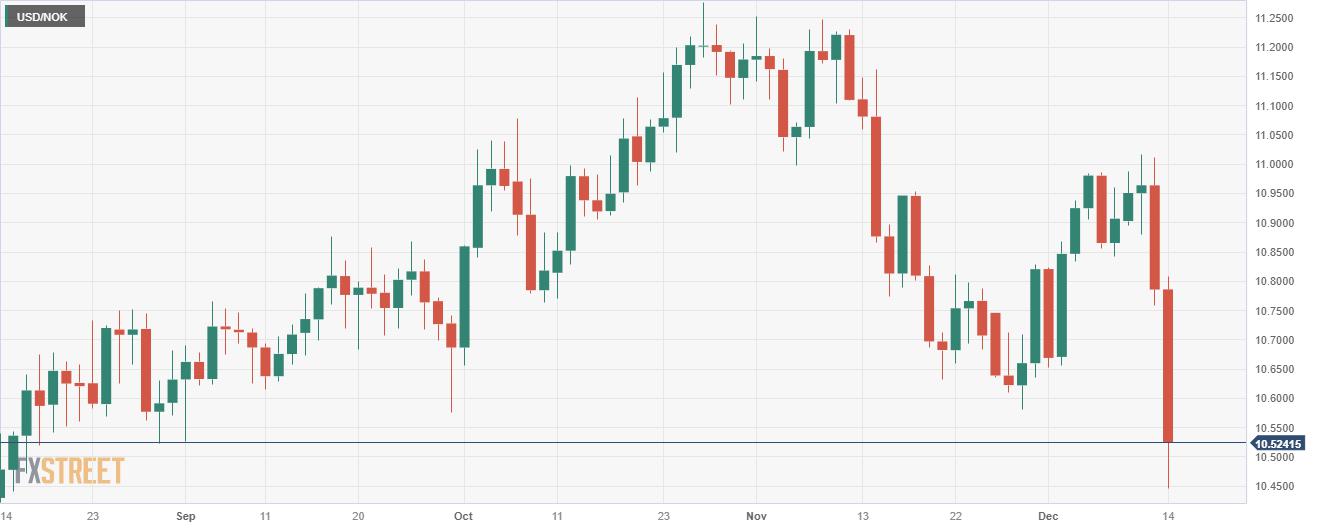
- The USD/NOK experienced a 2.35% downslide, trading close to the 10.520 level.
- Norges Bank increases benchmark interest rate by 25 bps to 4.50%
- US bond yields decline across the board after the Fed hinted a more easing than expected in 2024.
In Thursday's session, the USD/NOK pair took a downward tumble, plunging to its lowest level since August at about 10.520. This move was spurred by the decisions from higher-tier financial institutions, specifically Norges Bank and the Federal Reserve, which fueled a substantial 2.35% decline but mainly due to the Norwegian taking on an unexpected hike.
In line with that, Norges Bank announced a 25 bps in the policy rate, bringing it up to 4.50%, and suggested a potential halt of their rising rate cycle, as the terminal rate projections were slightly upped to 4.55% from 4.44%, in sync with previous forecasts and showing the little possibility of more hikes.
Despite the market and economists' low expectations, Norges Bank enforced the hike but it also changed its tone, exhibiting concern over the risks between over-tightening and under-tightening, hinting at a reduced inclination towards future hikes.
On the other hand, the Fed left rates steady at 5.25-5.50% as expected the official's median projections suggest that they expect 75 bps of easing in 2024. As a reaction, markets dumped the US Dollar, also driven by the bank’s hints of low odds of additional tightening, also fuelling the pair downwards.
USD/NOK levels to watch
The daily chart suggests that the pair finds itself in a bearish landscape, as the Relative Strength Index (RSI) portrays a negative slope in the negative territory while the Moving Average Convergence Divergence (MACD) histogram further confirms this bearish bias, presenting rising red bars.
On a broader context, the pair is nestled below the 20,100 and 200-day Simple Moving Averages (SMAs), cementing the control of the sellers also in the larger context.
Support Levels: 10.450, 10.400, 10.350.
Resistance Levels: 10.570, 10.680 (200-day SMA), 10.700.
USD/NOK daily chart
Reprinted from FXStreet,the copyright all reserved by the original author.
Disclaimer: The content above represents only the views of the author or guest. It does not represent any views or positions of FOLLOWME and does not mean that FOLLOWME agrees with its statement or description, nor does it constitute any investment advice. For all actions taken by visitors based on information provided by the FOLLOWME community, the community does not assume any form of liability unless otherwise expressly promised in writing.
FOLLOWME Trading Community Website: https://www.followme.com


Hot
No comment on record. Start new comment.