Chart of the Day - Russell 2000

Russell 2000 approaching key support
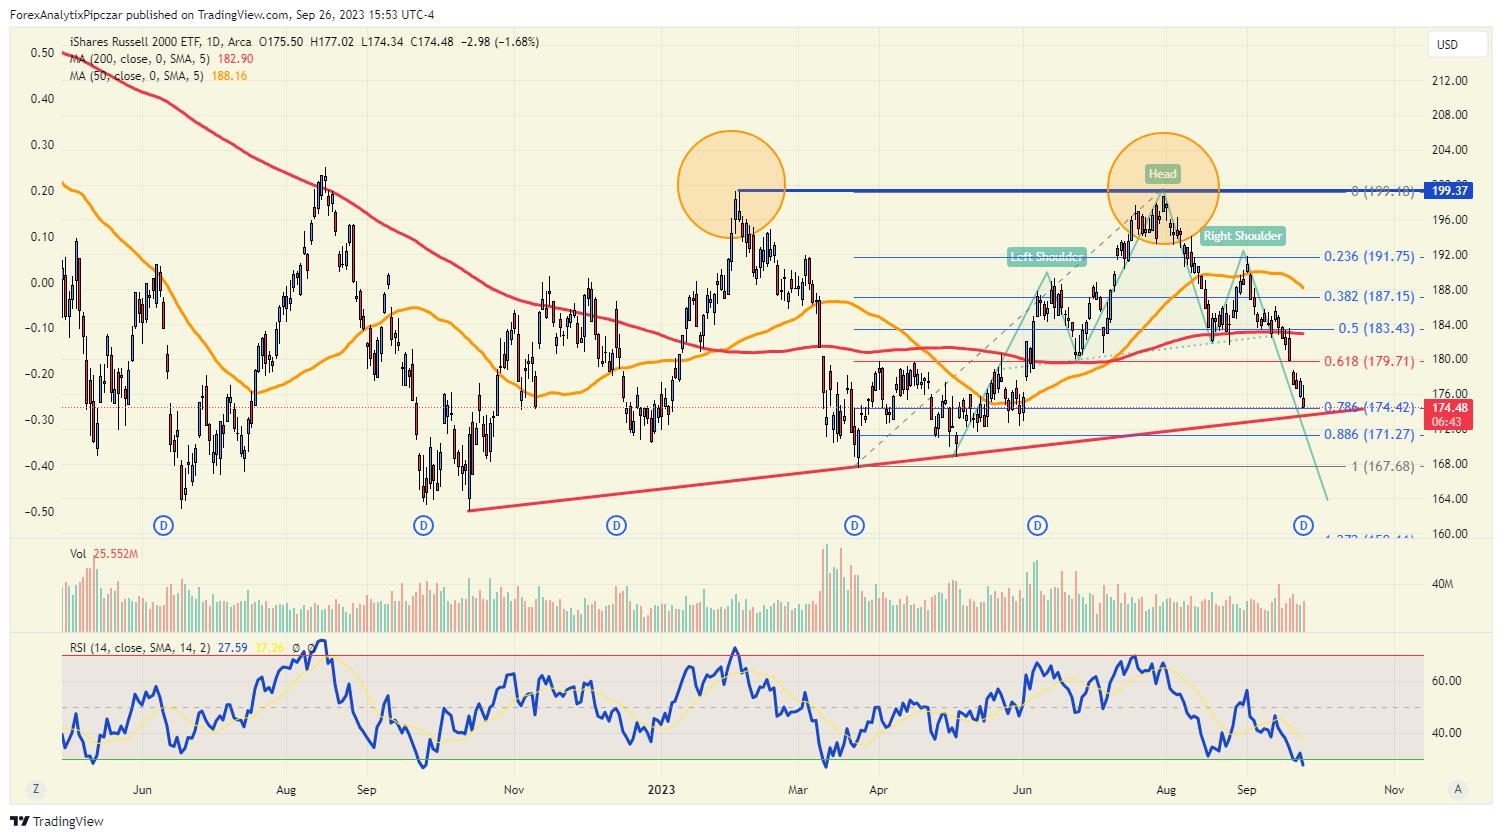
We have discussed the Russell 2000 head and shoulder pattern and long-term double top on many venues, whether this weekend's Week Ahead" video, or on our daily FACE shows, it's a familiar chart. However, the daily RSI has just reached oversold. Oversold and become MORE oversold and the pattern targets are actually towards 2022 lows, but the 78% retracement of the March lows to July 2023 highs is at 174.42, and the ascending trend line of the Oct 2022 lows to present day is not far away. These may be levels that provide a bounce and better levels to be on the short side like closer to 180 vs where we currently trade at 174.50.
Reprinted from FXStreet,the copyright all reserved by the original author.
Disclaimer: The content above represents only the views of the author or guest. It does not represent any views or positions of FOLLOWME and does not mean that FOLLOWME agrees with its statement or description, nor does it constitute any investment advice. For all actions taken by visitors based on information provided by the FOLLOWME community, the community does not assume any form of liability unless otherwise expressly promised in writing.
FOLLOWME Trading Community Website: https://www.followme.com


Hot
No comment on record. Start new comment.