USD/JPY Price Analysis: Gains momentum above the 143.60 area amid the stronger Dollar

- USD/JPY gains momentum and edges higher to the 143.65 mark.
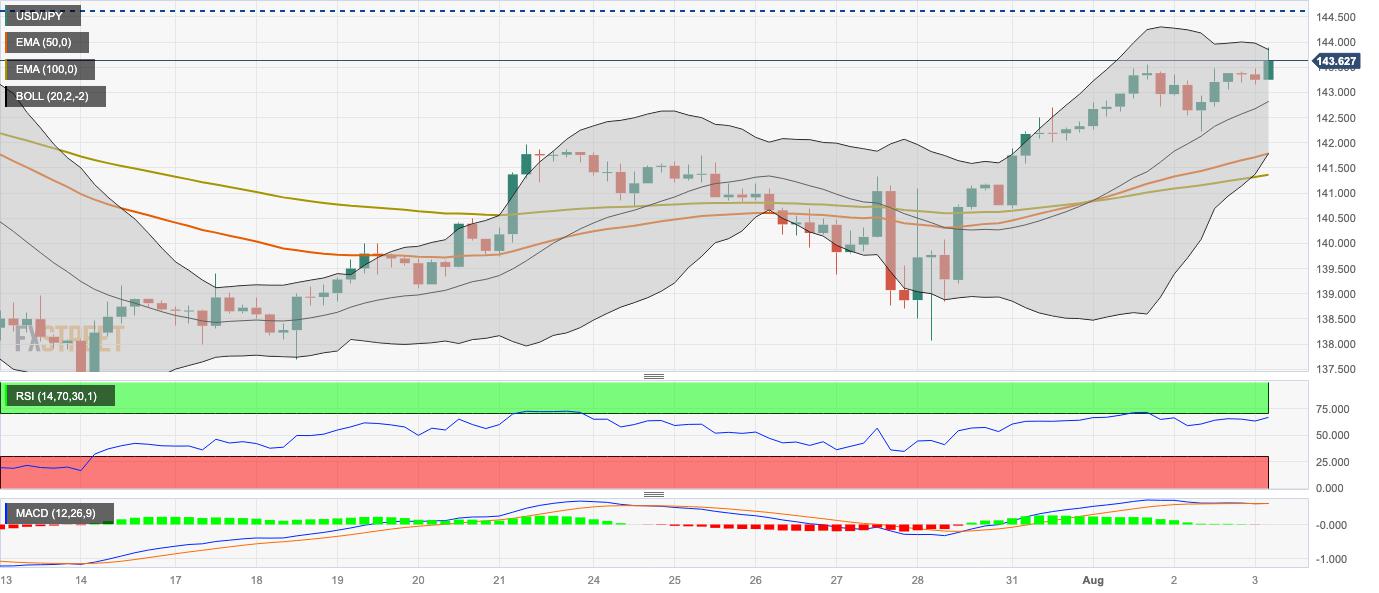
- The pair stands above the 50- and 100-hour EMAs with an upward slope.
- The initial resistance level to watch is 143.80; the first support stop is located at 142.80.
The USD/JPY pair extends its upside heading into the early European session on Thursday. Bank of Japan (BoJ) Governor Kazuo Ueda indicated that the tolerance band for the benchmark 10-year Japanese Government Bonds (JGB) will widen from 0.5% to 1.0%. The move pushed JGB yields to their highest level since 2014. The 10-year JGB rose to 0.65% on Thursday. The major pair currently trades around 143.65, up to 0.24% for the day.
According to the four-hour chart, the USD/JPY pair stands above the 50- and 100-hour Exponential Moving Averages (EMAs) with an upward slope, which means the path of least resistance is to the upside for the time being.
Any meaningful follow-through buying beyond 143.80 (the upper boundary of the Bollinger Band) could pave the way to the next hurdle at 144.65 (High of July 6). Further north, the 145.00 area appears to be a tough nut to crack for USD/JPY. The mentioned level is a confluence of a psychological round mark and a year-to-date high (YTD).
On the other hand, the first support stop for USD/JPY is located at 142.80 (midline of the Bollinger Band). The additional downside filter to watch is 141.78, highlighting the 50-hour EMA and the lower limit of the Bollinger Band. A decisive break below the latter would see a drop to 141.35 (100-hour EMA) and 141.00 (a psychological round figure).
It’s worth noting that the Relative Strength Index (RSI) stands above 50, and the MACD holds in bullish territory, which indicates that the upside momentum has been activated.
USD/JPY four-hour chart
Reprinted from FXStreet,the copyright all reserved by the original author.
Disclaimer: The content above represents only the views of the author or guest. It does not represent any views or positions of FOLLOWME and does not mean that FOLLOWME agrees with its statement or description, nor does it constitute any investment advice. For all actions taken by visitors based on information provided by the FOLLOWME community, the community does not assume any form of liability unless otherwise expressly promised in writing.
FOLLOWME Trading Community Website: https://www.followme.com


Hot
No comment on record. Start new comment.