EUR/GBP Price Analysis: “Death Cross” lures bears ahead of BoE despite latest inaction near 0.8600

- EUR/GBP remains sidelined after refreshing a one-week high the previous day.
- Bearish moving average crossover teases sellers but three-week-old rising support line can prod downside moves.
- BoE needs to defy dovish bias to convince EUR/GBP sellers.
- Five-week-old horizontal resistance challenges buyers targeting July’s top.
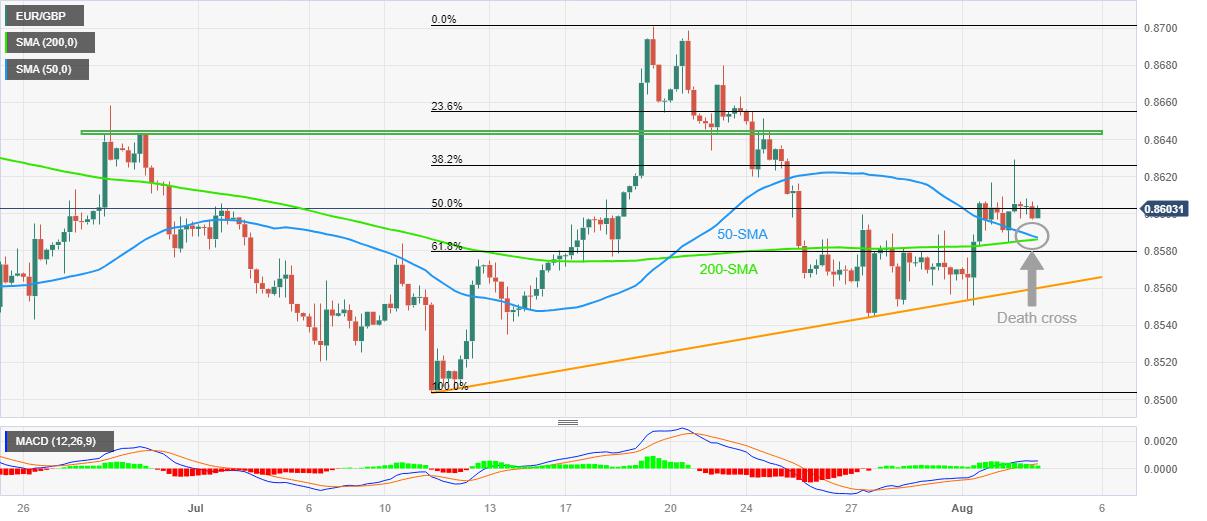
EUR/GBP aptly portrays the traders’ anxiety ahead of the Bank of England (BoE) Interest Rate Decision while making rounds to 0.8600 amid early Thursday in Europe. In doing so, the cross-currency pair pauses the two-day winning streak at the highest level since July 25.
Also read: Bank of England Preview: Sell Sterling? Why Bailey may break the Pound, even with a bigger hike
Apart from the market’s indecision about the size of the BoE’s rate increase, the impending “Death Cross” on the four-hour chart also highlights the EUR/GBP pair for the intraday traders. That said, “Death Cross” is a moving average cross when 50-SMA pierces 200-SMA from above and suggests further downside of the underlying.
It’s worth noting, however, that BoE’s hawkish move a clear break of the SMA confluence, around 0.8585 by the press time, becomes necessary to welcome the EUR/GBP sellers.
Even so, an upward-sloping support line from July 11, close to 0.8560 at the latest, can prod the bears before directing them to the previous monthly low of around the 0.8500 threshold.
Meanwhile, EUR/GBP recovery remains elusive unless crossing a five-week-old horizontal resistance area surrounding 0.8645.
Following that, July’s peak of near 0.8700 round figure may lure the EUR/GBP bulls.
EUR/GBP: Four-hour chart
Trend: Downside expected
Reprinted from FXStreet,the copyright all reserved by the original author.
Disclaimer: The content above represents only the views of the author or guest. It does not represent any views or positions of FOLLOWME and does not mean that FOLLOWME agrees with its statement or description, nor does it constitute any investment advice. For all actions taken by visitors based on information provided by the FOLLOWME community, the community does not assume any form of liability unless otherwise expressly promised in writing.
FOLLOWME Trading Community Website: https://www.followme.com


Hot
No comment on record. Start new comment.