AUD/JPY Price Analysis: Recovers some lost ground near the 94.00 barrier

- AUD/JPY attracts some buyers and holds ground near the 94.00 mark on Thursday.
- The stronger Chinese data offset the disappointing Australian data.
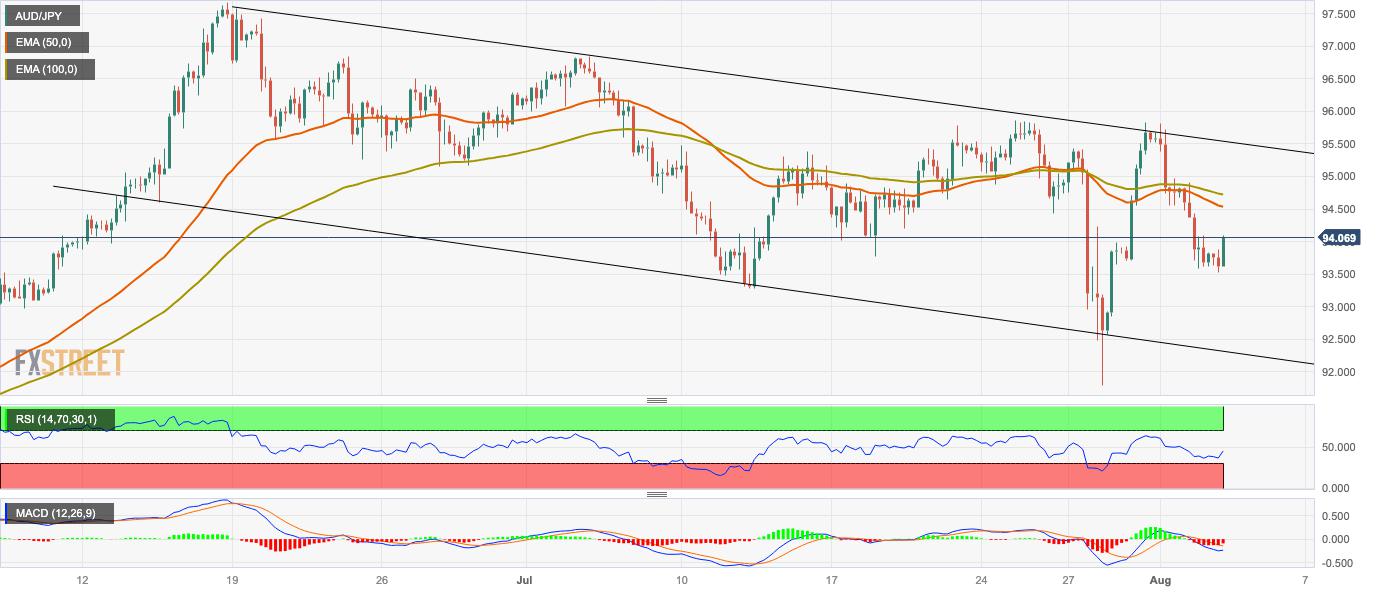
- AUD/JPY trades within a descending trend channel line from the middle of June.
- The immediate resistance level is seen at 95.50; the initial support level is located at 93.30.
The AUD/JPY cross recovers some lost ground and hovers around the 94.00 mark heading into the early European trading hours on Thursday. The cross currently trades around 94.07, gaining 0.37% for the day.
The stronger Chinese data on Thursday offset the disappointing Australian economic data. That said, China’s Caixin Services PMI climbed to 54.1 in July from 53.9 prior, better than the market consensus of 52.5. The upbeat Chinese economic figure could benefit the China-proxy Australian Dollar (AUD) against its rivals.
From a technical perspective, AUD/JPY trades within a descending trend channel line from the middle of June on the four-hour chart. That said, the path of least resistance for the AUD/JPY is to the downside as the cross holds below the 50- and 100-hour Exponential Moving Averages (EMAs).
95.50 acts as the immediate resistance level for AUD/JPY. The mentioned level indicates the upper boundary of a descending trend channel and a high of August 1. The next barrier to watch is 96.85 (High of July 4) en route to 97.60 (YTD high).
On the downside, the cross will meet an initial support level at 93.30 (Low of July 12). The next downside stop appears at 92.60 (Low of July 28) and 92.40 (the lower limit of a descending trend channel). A break below the latter will see a drop to 92.15 (Low of June 6).
It’s worth noting that the Relative Strength Index (RSI) and Moving Average Convergence/Divergence (MACD) hold in bearish territory, supporting the sellers for now.
AUD/JPY four-hour chart
Reprinted from FXStreet,the copyright all reserved by the original author.
Disclaimer: The content above represents only the views of the author or guest. It does not represent any views or positions of FOLLOWME and does not mean that FOLLOWME agrees with its statement or description, nor does it constitute any investment advice. For all actions taken by visitors based on information provided by the FOLLOWME community, the community does not assume any form of liability unless otherwise expressly promised in writing.
FOLLOWME Trading Community Website: https://www.followme.com


Hot
No comment on record. Start new comment.