Gold Price Forecast: XAU/USD struggles to extend gains on upbeat US ADP Employment data

- Gold price is facing barricades in stretching its recovery move further ahead of US NFP data.
- The Fed might continue its interest rates on an elevated level for a longer period.
- An upbeat US ADP Employment Change data bolsters the expectations of solid US NFP data ahead.
Gold price (XAU/USD) has attempted a recovery move after dropping to near $1,825.00 in the late New York session. The precious metal is struggling to extend its rebound further as solid United States Automatic Data Processing (ADP) Employment Change data has triggered the risk of continuation of higher interest rate stability by the Federal Reserve (Fed) for a secular period.
S&P500 witnessed a massive sell-off from the market participants, portraying a risk-aversion theme, as higher additions of fresh payrolls in the United States labor market will compel the Fed to keep its hawkish stance on interest rates for a longer period. This has also triggered a risk of recession in the US economy. The Employment Change (Dec) soared to 235K vs. the expectations of 150K and the former release of 127K. Also, the weekly Initial Jobless Claims (IJC) has dropped to 204K vs. the consensus of 225K.
The US Dollar Index (DXY) recorded a juggernaut rally after sustaining above the critical resistance of 104.00 and climbed to near 105.00. Also, the 10-year US Treasury yields sensed demand and gained to near 3.72%.
On Friday, investors will keep an eye on US Nonfarm Payrolls (NFP) data. After observing upbeat cues from ADP Employment Change, it is highly likely that the US NFP will release better-than-projected data. The Unemployment Rate is seen stable at 3.7%.
Gold technical analysis
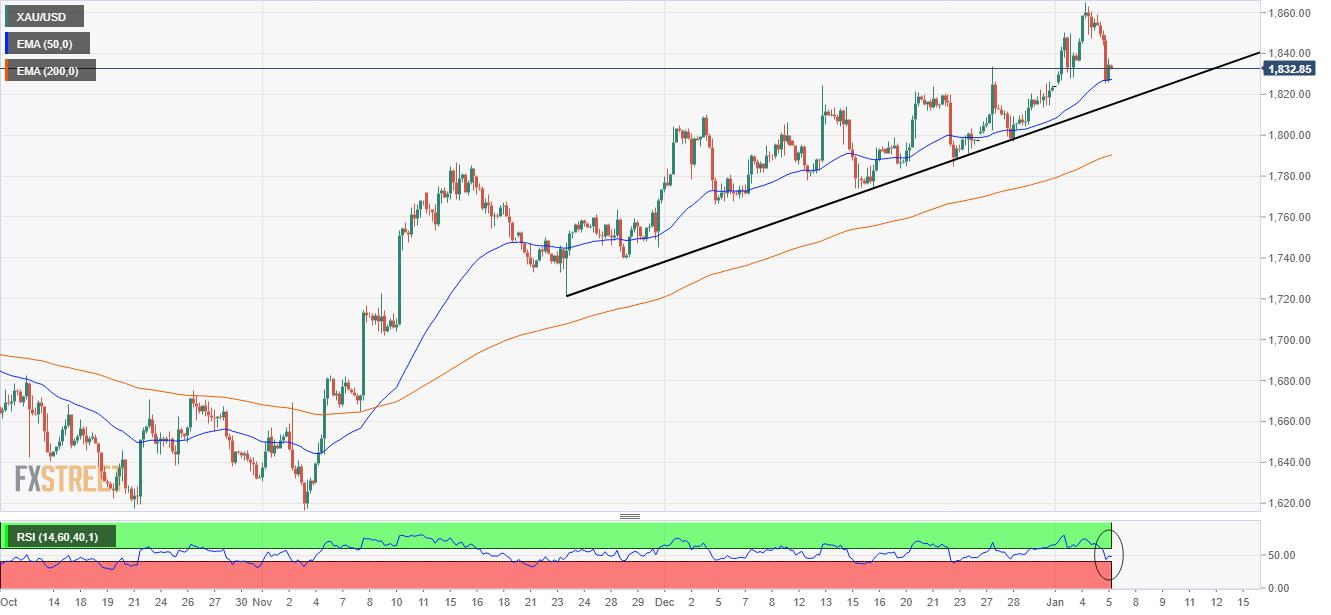
On a four-hour scale, the Gold price has dropped to near the 50-period Exponential Moving Average (EMA) at $1,827.60 after failing to extend rally. The upward-sloping trendline placed from November 23 low at $1,721.23 will act as major support for the precious metal ahead. Also, the 200-EMA at $1,790.23 has not been tested yet, which indicates that the long-term trend is still bullish.
The Relative Strength Index (RSI) (14) has dropped to near 40.00 which signals a consolidation ahead.
Gold four-hour chart
Reprinted from FXStreet_id,the copyright all reserved by the original author.
Disclaimer: The content above represents only the views of the author or guest. It does not represent any views or positions of FOLLOWME and does not mean that FOLLOWME agrees with its statement or description, nor does it constitute any investment advice. For all actions taken by visitors based on information provided by the FOLLOWME community, the community does not assume any form of liability unless otherwise expressly promised in writing.
FOLLOWME Trading Community Website: https://www.followme.com


Hot
No comment on record. Start new comment.