USD/CHF Price Analysis: Steadily advances above 0.9350 after breaking a falling wedge

- USD/CHF climbs steadily, bolstered by US economic data and speculation for further Fed tightening.
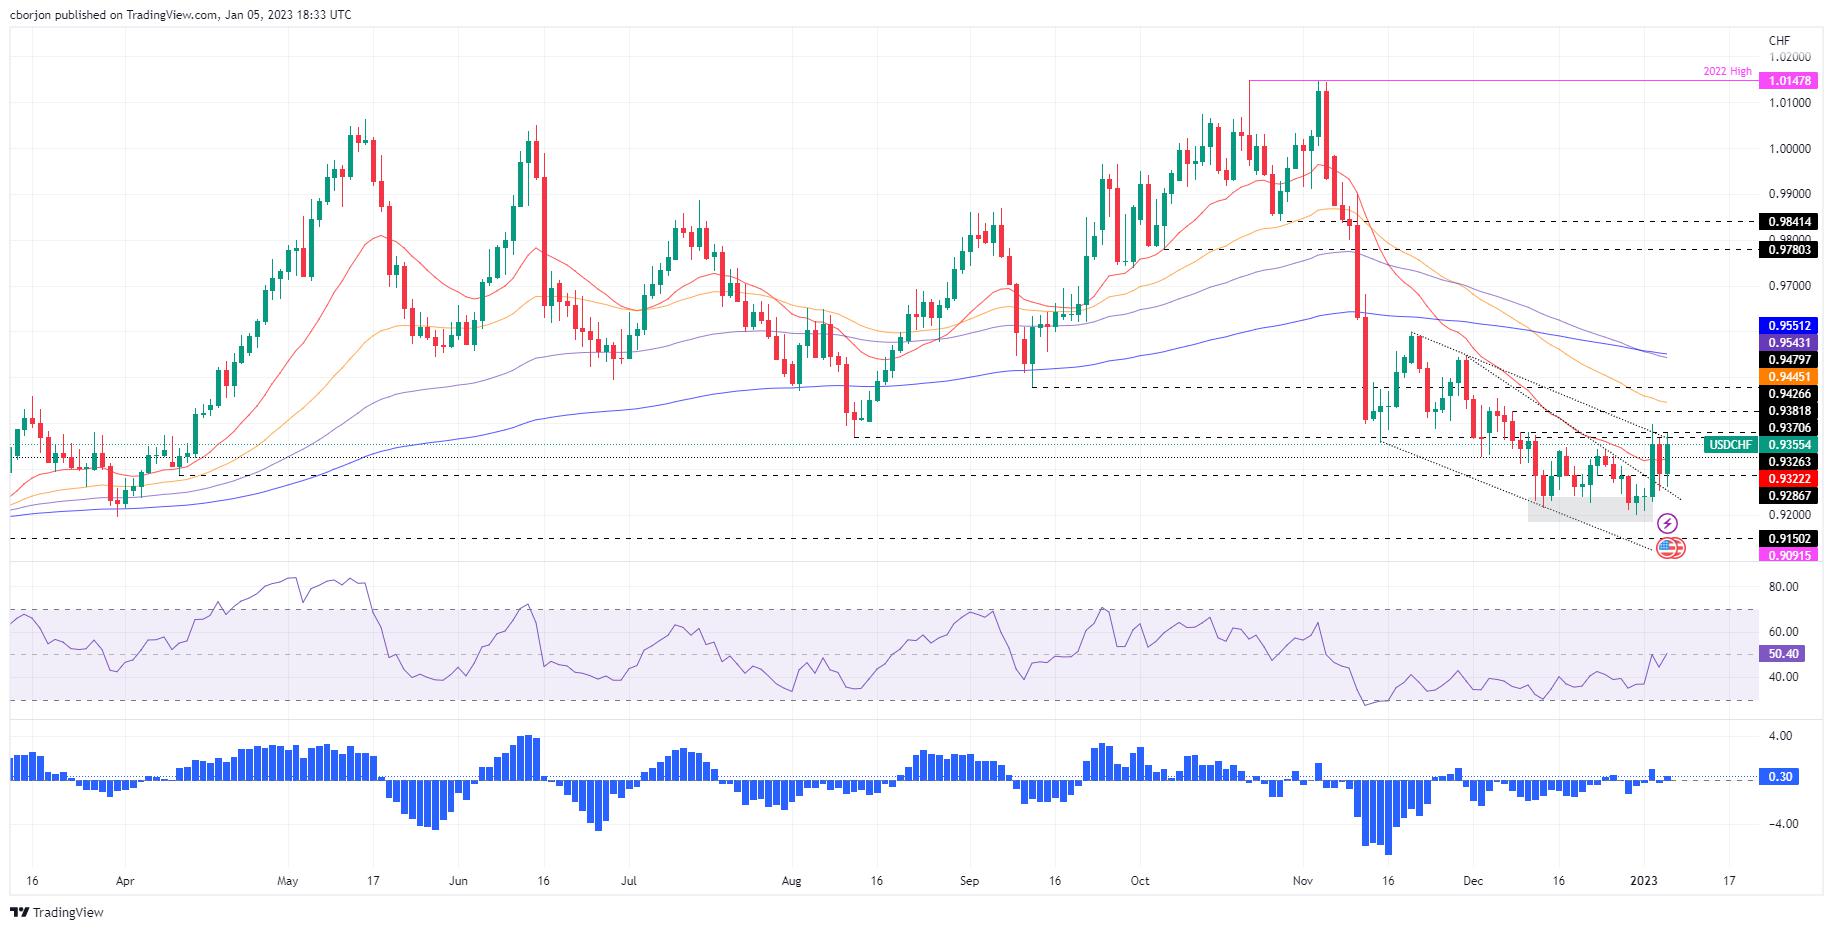
- The USD/CHF pairs bounced at around a top-trendline of a falling wedge which turned support around 0.9250.
- A daily close above 0.9366 could send the USD/CHF rallying towards 0.9400 and beyond.
The USD/CHF erases Wednesday’s losses and rises more than 70 pips on Thursday, clearing on its way north solid resistance levels, like the 20-day Exponential Moving Average (EMA) at 0.9322. Factors like the release of robust labor market data in the United States (US) lifted the USD/CHF from around daily lows of 0.9260. At the time of writing, the USD/CHF is trading at 0.9360.
USD/CHF Price Analysis: Technical outlook
After finding support at around 0.9200, the USD/CHF resumed its uptrend, eyeing a break above Wednesday’s daily high of 0.9366. The USD/CHF dropped towards the top-trend line of a falling wedge, previously broken during the week, turned support. Hence, the major bounced at around 0.9250 and aimed toward a downslope resistance trendline that passed around 0.9370.
If the USD/CHF achieves a daily close above 0.9366, that could open the door for further upside, implying a test of the 0.9400 mark, which, once cleared, would send the USD/CHF aiming towards the 100-day EMA at 0.9445, followed by a test of 0.9500.
As an alternate scenario, the USD/CHF first support would be the 20-day EMA at 0.9322, followed by the 0.9300 figure and the top trendline of a falling wedge that resides around 0.9250.
USD/CHF Key Technical Levels
Reprinted from FXStreet_id,the copyright all reserved by the original author.
Disclaimer: The content above represents only the views of the author or guest. It does not represent any views or positions of FOLLOWME and does not mean that FOLLOWME agrees with its statement or description, nor does it constitute any investment advice. For all actions taken by visitors based on information provided by the FOLLOWME community, the community does not assume any form of liability unless otherwise expressly promised in writing.
FOLLOWME Trading Community Website: https://www.followme.com


Hot
No comment on record. Start new comment.