AUD/JPY Price Analysis: W-formation spotted on daily chart

- AUD/JPY bulls could be tiring at this juncture.
- The bears are looking to the W-formation's neckline as a target for the days ahead.
AUD/JPY has performed well on the bid this week and there could be more to go. However, the W-formation on the daily chart is a compelling feature that could play out in a downside correction for the days ahead.
AUD/JPY daily chart
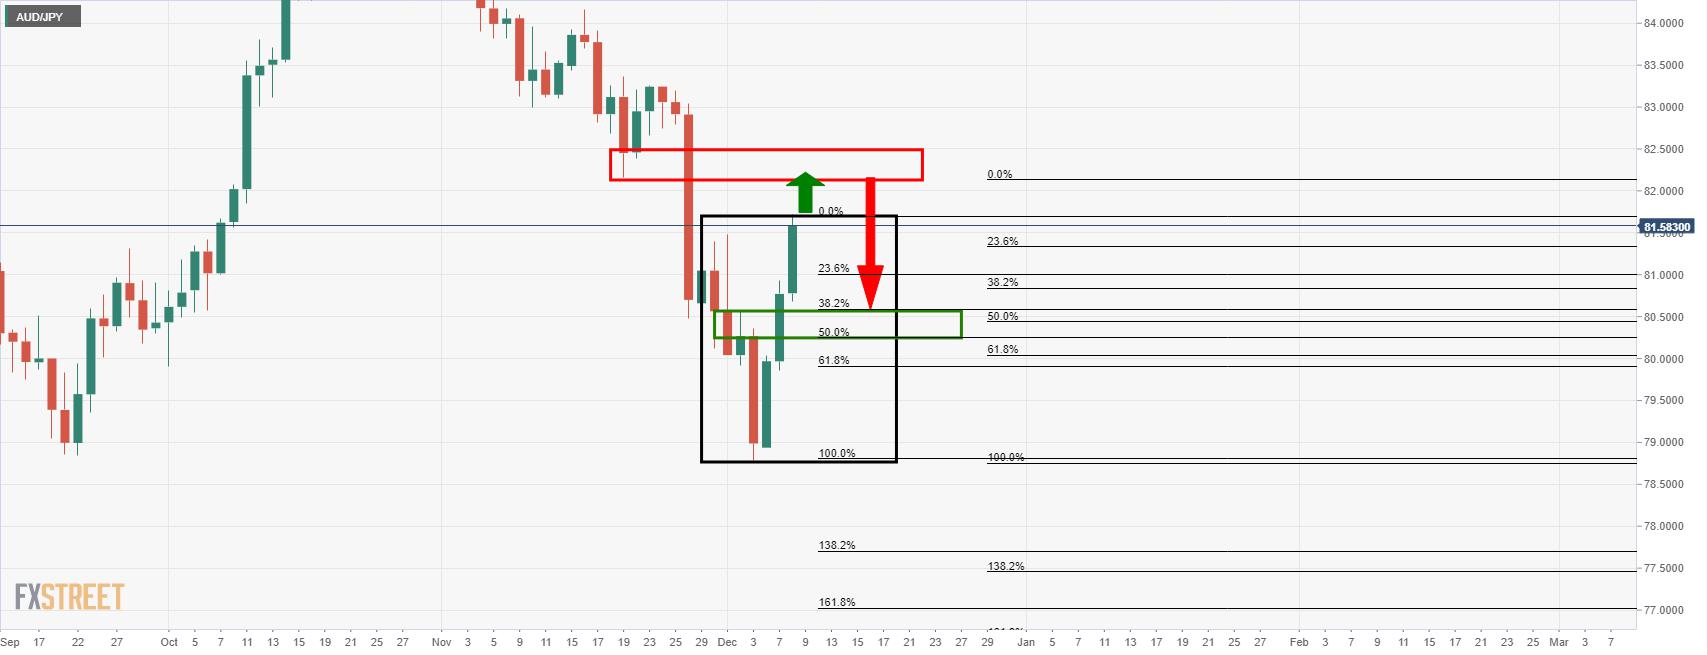
While there is room to go until the next presumed resistance area, around 82.1580, the price is leaving a W-formation. This is a reversion pattern that has a high completion rate in that the price would be expected to retreat in due course and restest the neckline of the W-pattern. This is between the wick of Dec 2 and the opening of the same candle 80.5630 and 80.2452.
AUD/JPY H1
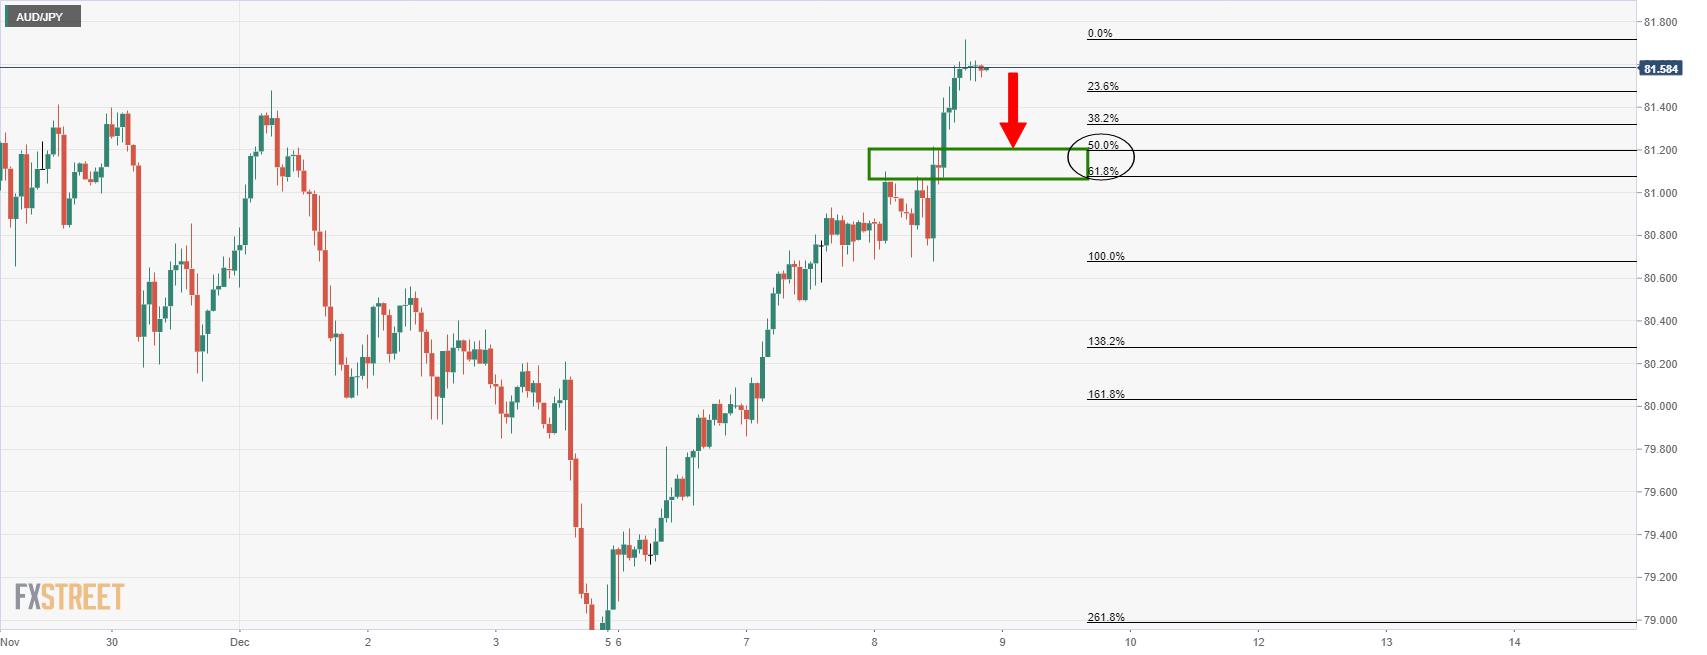
The hourly chart has a confluence between the old resistance structure and the 50% / 61.8% ratios on the downside. This would be expected to hold initial tests. However, a break there will open the prospects of a downside continuation to target the daily W-formation's neckline.
Reprinted from FXStreet,the copyright all reserved by the original author.
Disclaimer: The content above represents only the views of the author or guest. It does not represent any views or positions of FOLLOWME and does not mean that FOLLOWME agrees with its statement or description, nor does it constitute any investment advice. For all actions taken by visitors based on information provided by the FOLLOWME community, the community does not assume any form of liability unless otherwise expressly promised in writing.
FOLLOWME Trading Community Website: https://www.followme.com


Hot
No comment on record. Start new comment.