-
The XAU/USD chart was unable to break above the resistance trend line (orange) and is now testing the support trend line (green).
-
Price action seems to be building 3 corrective waves down after 5 impulsive waves up. Now an ABC zigzag pattern seems to be taking place in wave 2 or B.
-
The target is the previous top. A break below the 100% Fib places the bullish ABC or 123 (pink) on hold (orange sign).
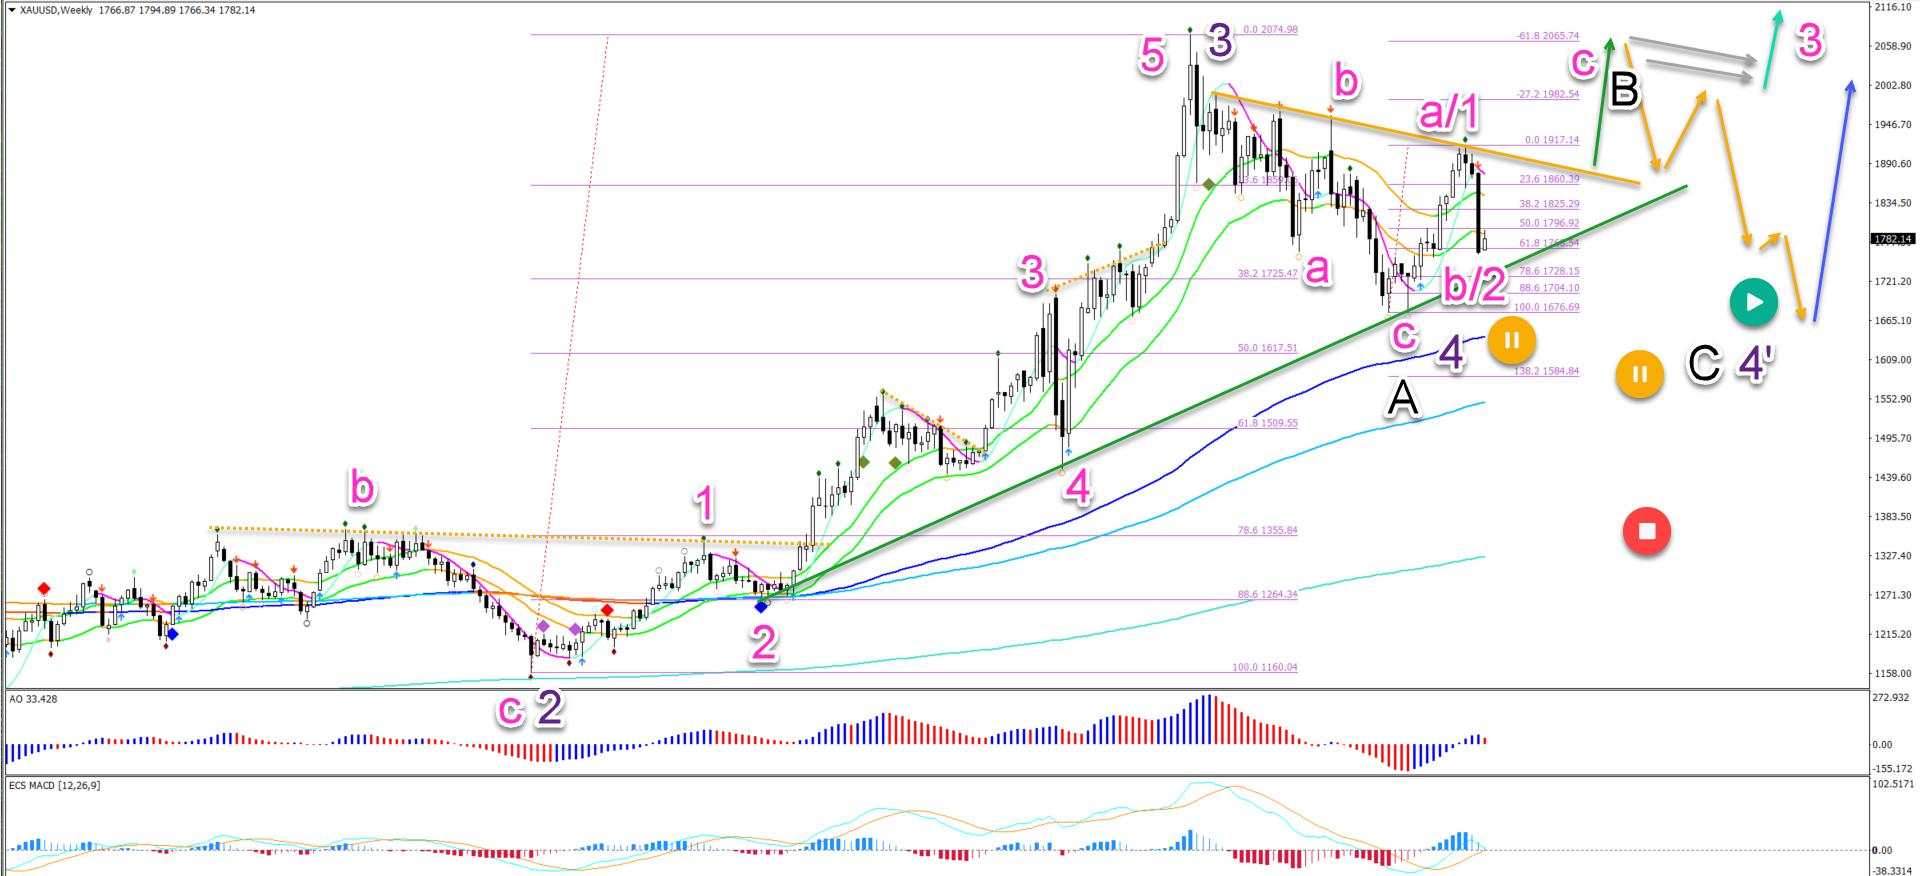
The XAU/USD (Gold) weekly chart made a bearish reversal contrary to our previous analysis. This indicates that price action has either completed a wave 1 or A (pink).
This article analyzes what to expect from the wave 4 retracement (purple).
Price charts and technical analysis
The XAU/USD chart was unable to break above the resistance trend line (orange) and is now testing the support trend line (green):
-
A bullish bounce at the support line (green) and 61.8%, 78.6% or 88.6% Fibonacci retracement levels of the wave B/2 (pink) could confirm one more bullish swing.
-
The target is the previous top. A break below the 100% Fib places the bullish ABC or 123 (pink) on hold (orange sign).
-
If price action gets close to the previous top, then the price reaction will be very important.
-
A bull flag (grey arrows) pattern could indicate more uptrend (aqua blue arrow).
-
A bearish reversal (orange arrows) could indicate a bearish ABC (black) pattern in wave 4’ (purple).
-
Any deeper retracement places the uptrend on hold (orange and red signs).
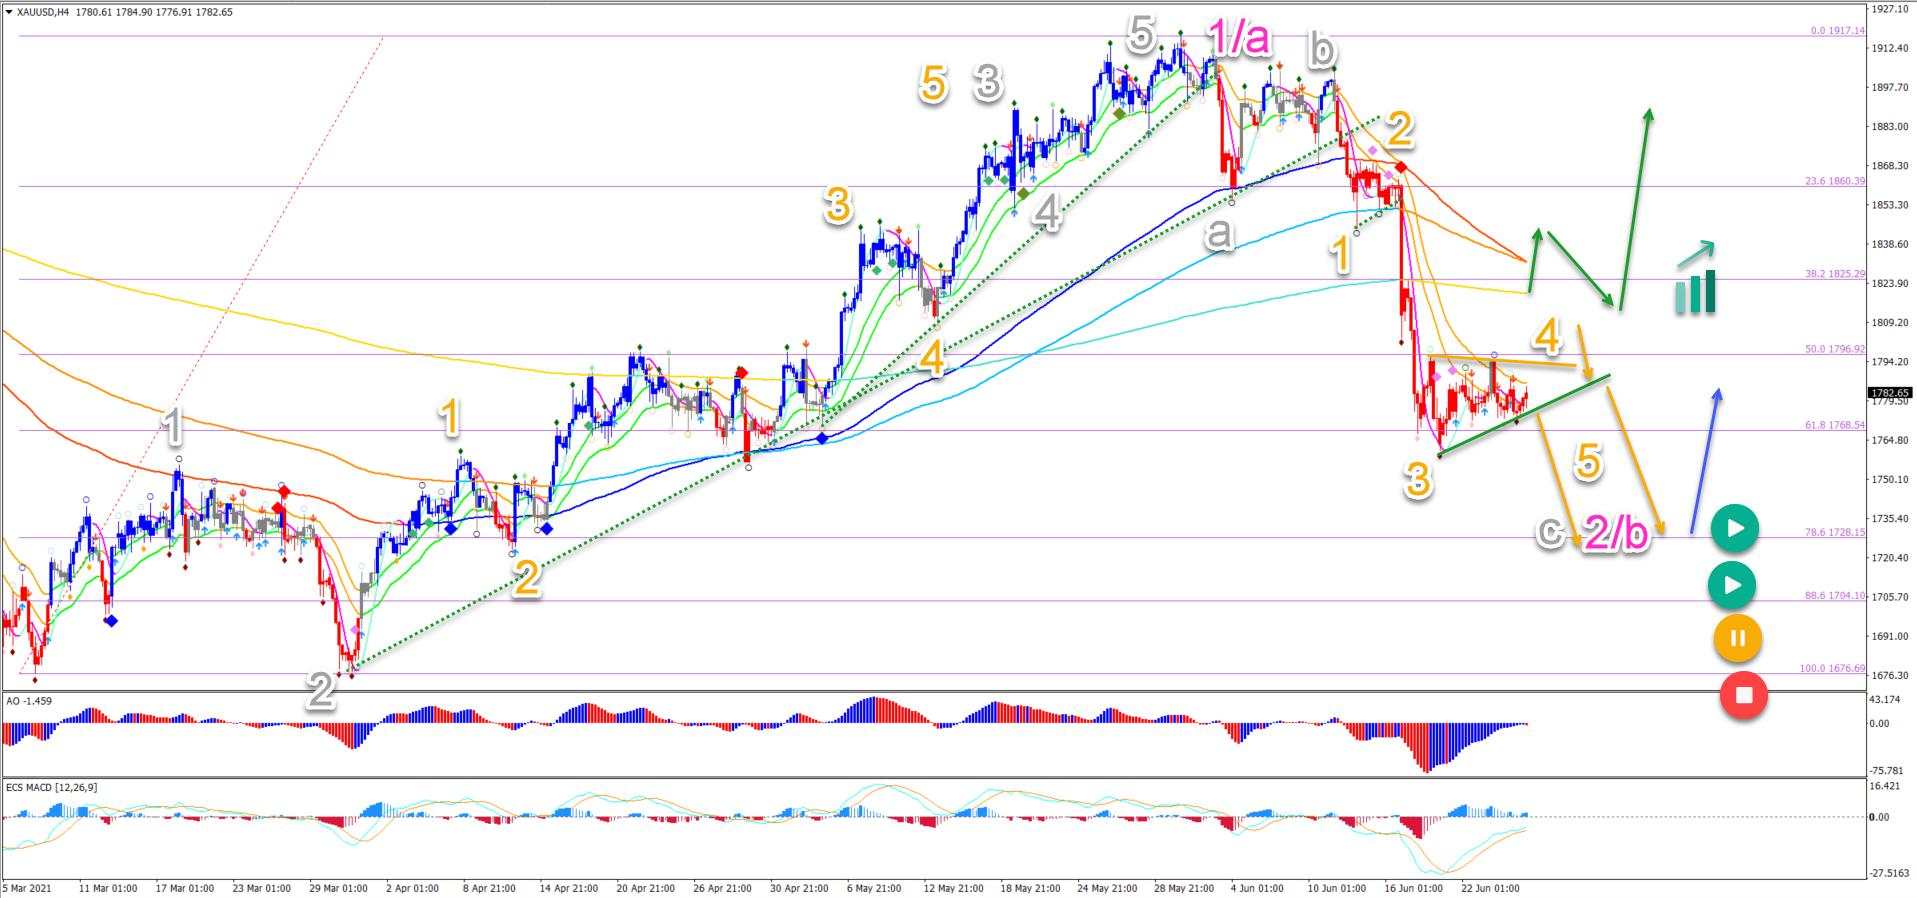
On the 4 hour chart, price action seems to be building 3 corrective waves down after 5 impulsive waves up:
-
The 5 bullish waves (grey) completed a wave 1 or A (pink).
-
Now an ABC (grey) zigzag pattern seems to be taking place in wave 2 or B (pink).
-
A bearish breakout (orange arrows) below the support line (green) could aim at the 78.6% Fibonacci level.
-
A bullish bounce (blue arrow) at the deep Fibonacci retracement levels is expected.
-
A bullish breakout above the long-term moving averages could indicate the end of the bearish ABC (grey) as well and the start of a bullish price swing.
The analysis has been done with the ecs.SWAT method and ebook.
Reprinted from FXStreet,the copyright all reserved by the original author.
Disclaimer: The views expressed are solely those of the author and do not represent the official position of Followme. Followme does not take responsibility for the accuracy, completeness, or reliability of the information provided and is not liable for any actions taken based on the content, unless explicitly stated in writing.

Leave Your Message Now