
Heikin Ashi?
You’re probably familiar with the three popular chart types: line chart, bar chart, and the candlestick chart.
But there’s another type of chart that you should know about that uses a totally different technique to display price action.
The Heikin Ashi.
Like the beer?
Umm nope. Let’s focus now. We’re NOT talking about beer here!
We’re talking about CHARTS! (Although the spelling does seem pretty close. 🤔)
“Heikin Ashi”, also known as “Heikin-Ashi” or “Heiken Ashi” is a charting technique used to display prices that, at a glance, looks similar to a traditional Japanese candlestick chart.
The difference is the method used in how candlesticks are calculated and plotted on a chart.
Traditional Japanese candlesticks are great at helping you find good entry points since they display potential reversals (like a shooting star) or breakout (like a bullish marubozu closing above a resistance level).
But what about once you’re IN a trade?
Applying the Heikin Ashi technique to a price chart can help you decide whether to stay in the trade or get out.
Heikin Ashi charts make candlestick charts more readable for traders who want to know when to stay in a trade and ride a strong trend and when to get out when the trend weakens.
Basically, Heikin Ashi is a modified candlestick charting technique that rearranges how the price is displayed so trend traders can have a higher confidence level when deciding whether to remain in a trade or exit.Some traders, usually longer-term traders, use Heikin Ashi charts as an alternative to traditional Japanese candlestick charts.
Other traders use them in conjunction with traditional Japanese candlestick charts, switching back-and-forth between the two.
What is Heikin Ashi?
In Japanese, Heikin means “average” and Ashi means “pace”. So together, Heikin Ashi means the “average pace of price”.
 Heikin Ashi is a type of candlestick charting technique used to help filter market noise.
The Heikin Ashi technique was created hundreds of years ago by Munehisa Homma, a rice merchant from Sakata, Japan, who is considered the father of the candlestick chart.
So Darth Vader is to Luke Skywalker, as Munehisa Homma is to Heikin Ashi.
Homma realized that by tracking the price action in the rice market, he could actually “see” the psychological behavior of other market participants, and make use of it.
Here’s an example of a Heikin Ashi chart: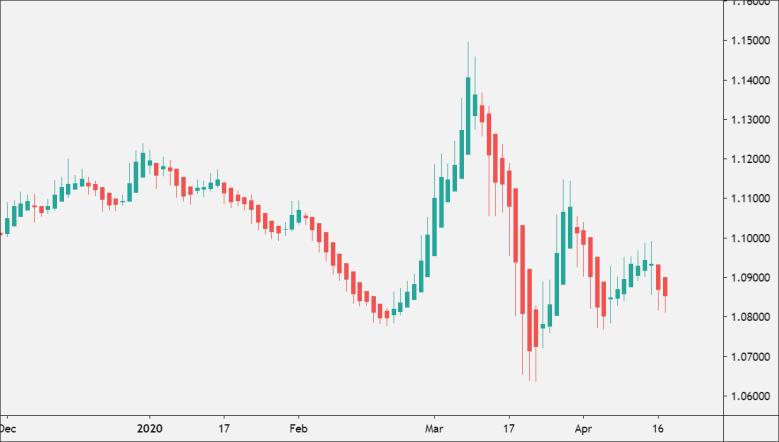
To the untrained eye, the chart looks like your typical Japanese candlestick chart.
Each Heiki Ashi candlestick has a body and an upper and/or lower shadow (or wick).
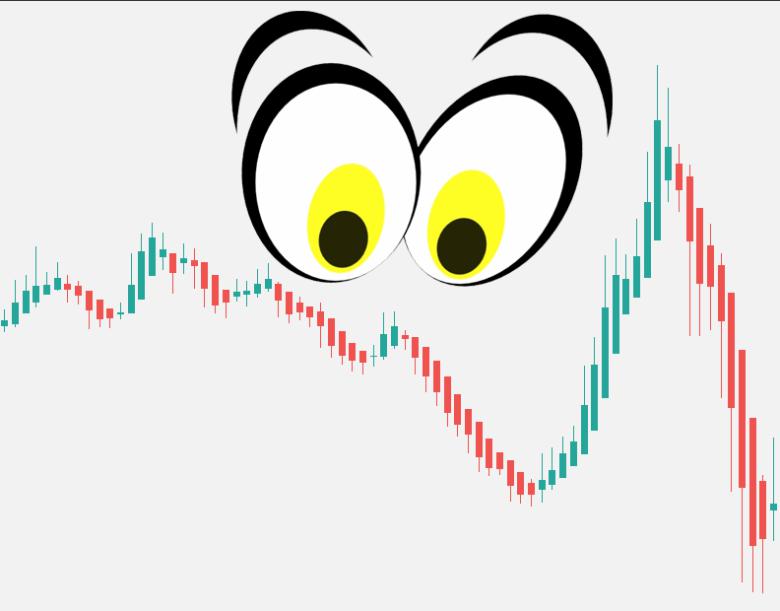
They’re the same right?
Nope.
There’s a BIG difference between the two types of candlestick charts.
Let’s learn what that difference is.


Hot
No comment on record. Start new comment.