
How do you calculate Heikin Ashi?
Let’s learn how Heikin Ashi candlesticks are calculated and plotted on a chart.
Like we mentioned in the previous lesson, to a noob’s eye, they may look like regular candlesticks but they….are….not.
It’s kind of like being able to tell the difference between a wolf and a dog.

Looks cute and adorable right? Looks harmless?
Like you want to hug it?
Is this a Husky doggo or a wolf?
Before you go try and pet it, you better be able to tell the difference before you get your face bit off and blood starts gushing everywhere and you attract an entire wolf pack providing them an all-you-can-eat buffet.
It’s the same way with Heikin Ashi charts and traditional Japanese candlestick charts, you better be able to tell them apart or your trading account might end up bleeding red.

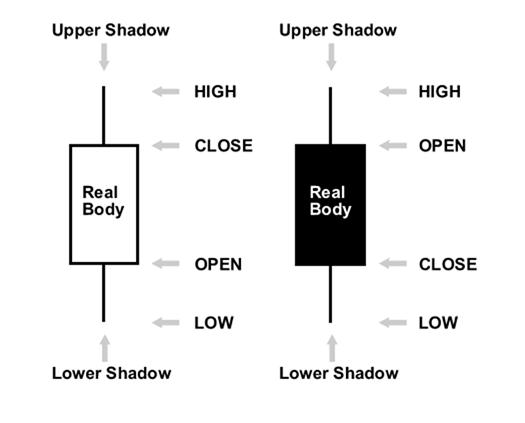
With traditional Japanese candlestick charts, each candlestick represents the open, high, low, and close that the price makes within the current time period.
With Heikin Aishi candlestick charts, each candlestick doesn’t just include price movement within the current time period, it also includes price information from the past.
Say what?
Let’s see how a Heikin Ashi candlestick is calculated and take it one step at a time.First, let’s throw up a Heikin Ashi chart of GBP/JPY to use as reference:
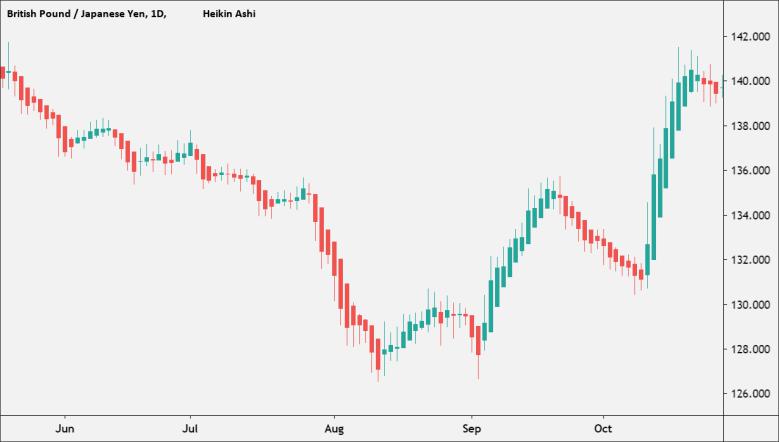
As you can see, it’s similar to a traditional Japanese candlestick except that the open and close are calculated differently.
Just like a regular Japanese candlestick, each Heikin Ashi candle has an open, close, high and low.
This means that there are FOUR parts of the Heikiin Aishi formula:
The OPEN of a Heikin Ashi candlestick equals the MIDPOINT of the previous candle.
If you look closely at the chart, you’ll notice that every new candlestick starts from the middle of the previous one.
Open = [(Open price of previous candle) + (Close price of previous candle)] / 2
The CLOSE of each Heikin Ashi candlestick equals the average value between the four parameters: open, close, high, and low:
Close = (Open + High + Low + Close) / 4
The HIGH of a Heikin Ashi candlestick takes the actual high of the period. This could be the highest shadow, the open, or the close. Whichever is the highest.
High = Maximum Price Reached
The LOW of a Heikin Ashi candlestick takes the actual low of the period. This could be the lowest shadow, the open, or the close. Whichever is the lowest.
Low = Minimum Price Reached
The general idea behind the Heikin Ashi candlesticks is that they smooth the price action.
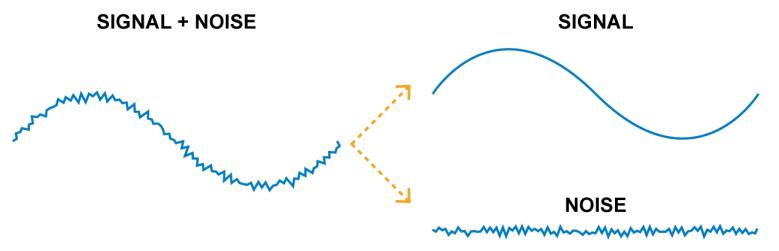
Much of the market noise shown with traditional Japanese candlestick charts are minimized with the Heikin Ashi candlestick chart.
Here’s a summary of the Heikin Aishi formula:Heikin Ashi Formula: High = Maximum of High, Open, or Close (whichever is highest) Low = Minimum of Low, Open, or Close (whichever is lowest) Open = [Open (previous bar) + Close (previous bar)] /2 Close = (Open + High + Low + Close) / 4


Hot
No comment on record. Start new comment.