NZD/USD Price Analysis: Hangs near multi-week lows, below mid-0.7100s ahead of NFP

- NZD/USD witnessed heavy selling for the third straight day and dropped to five-week lows.
- The set-up has shifted in favour of bearish traders and supports prospects for further losses.
- Any attempted recovery towards the 0.7160 region might be seen as a selling opportunity.
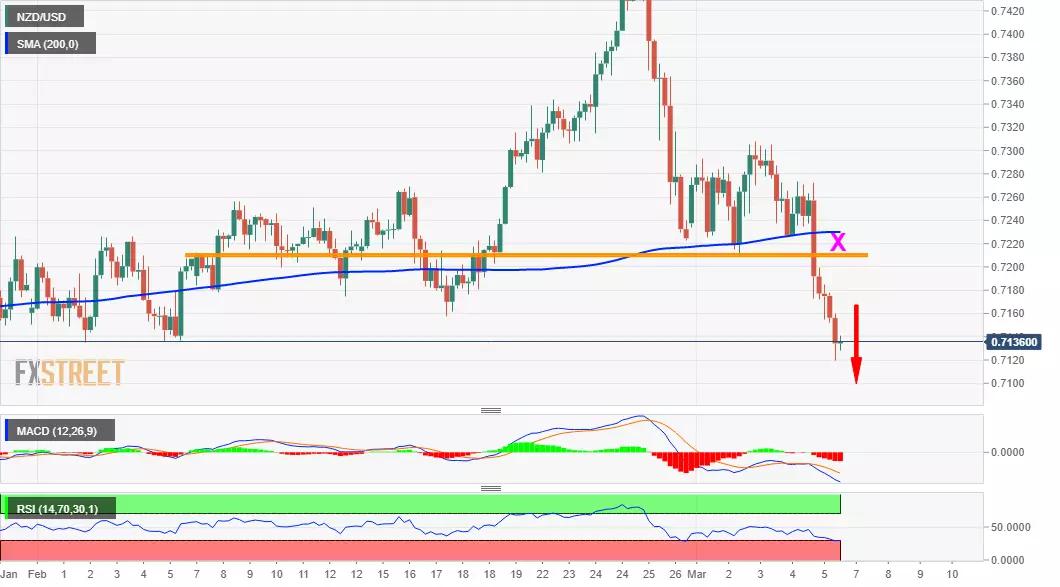
The NZD/USD pair maintained its heavily offered tone through the mid-European session and was seen trading near five-week lows, around the 0.7130 region ahead of NFP.
Given that this week's bounce faced rejection near the 0.7300 mark, the overnight break below the 0.7230-25 support was seen as a key trigger for bearish traders. A subsequent slide below the 0.7200 mark reaffirmed the bearish breakdown and exerted pressure on the major for the third consecutive session on Friday.
Meanwhile, oscillators on the daily chart have been gaining negative momentum and support prospects for an extension of the recent sharp pullback from the highest level since August 2018. That said, RSI (14) on hourly charts is already flashing oversold conditions and seemed to be the only factor that helped limit losses.
From current levels, the next relevant support is pegged near the 0.7100 mark, which if broken decisively should pave the way for additional weakness. The NZD/USD pair might then accelerate the fall towards the 0.7045-40 intermediate support before eventually dropping to challenge the key 0.7000 psychological mark.
On the flip side, any attempted recovery beyond the 0.7155-60 region might be seen as a selling opportunity. This, in turn, should cap the upside for the NZD/USD pair near the 0.7190-0.7200 region. This is closely followed by the 0.7225 support breakpoint, which should now act as a short-term top for the major.
NZD/USD 4-hourly chart
Technical levels to watch
Reprinted from FXStreet,the copyright all reserved by the original author.
Disclaimer: The content above represents only the views of the author or guest. It does not represent any views or positions of FOLLOWME and does not mean that FOLLOWME agrees with its statement or description, nor does it constitute any investment advice. For all actions taken by visitors based on information provided by the FOLLOWME community, the community does not assume any form of liability unless otherwise expressly promised in writing.
FOLLOWME Trading Community Website: https://www.followme.com


Hot
No comment on record. Start new comment.