GBP/USD Price Analysis: Turns vulnerable below a short-term ascending trend-line support

- GBP/USD remained under some selling pressure for the second straight session on Monday.
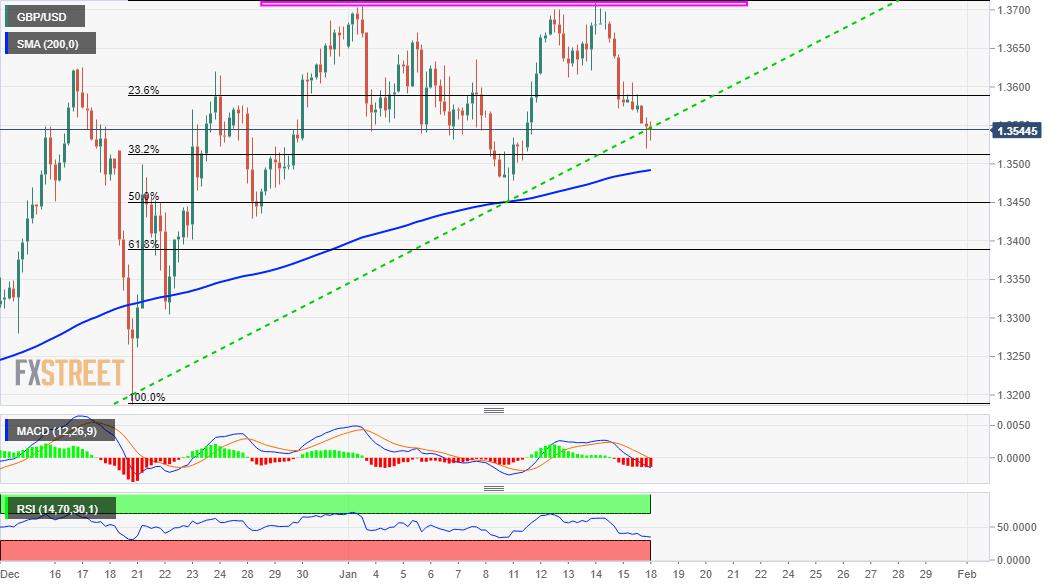
- Repeated failures near the 1.3700 level constituted the formation of a bearish multiple-tops.
- A subsequent fall below an ascending trend-line might have set the stage for a further decline.
The GBP/USD pair witnessed some follow-through selling for the second consecutive session on Monday and retreated further from multi-year tops, around the 1.3700-1.3710 region set last week. Repeated failures near the mentioned supply zone constituted the formation of a bearish multiple-top pattern on short-term charts.
Meanwhile, the retracement slide extended through the mid-European session and dragged the GBP/USD pair to multi-day lows, around the 1.3520 region. This marks a bearish break below a near one-month-old ascending trend-line support and might have already set the stage for a further near-term depreciating move.
The bearish outlook is further reinforced by the fact that technical indicators have been gaining negative traction on hourly charts. That said, oscillators on the daily chart – though have been losing positive momentum – are yet to confirm the bearish bias and thus, warrant some caution for aggressive traders.
Hence, it will be prudent to wait for some follow-through selling below the 38.2% Fibonacci level of the 1.3188-1.3710 positive move before placing fresh bearish bets. A subsequent fall below the key 1.3500 psychological mark will reaffirm the negative set-up and drag the GBP/USD pair to 50% Fibo. level, around mid-1.3400s.
On the flip side, any meaningful recovery back above the mentioned trend-line support breakpoint might now be seen as a selling opportunity. This, in turn, should cap the upside for the GBP/USD pair near the 23.6% Fibo. level, or levels just ahead of the 1.3600 mark. However, a sustained strength beyond will negate the negative outlook.
GBP/USD 4-hourly chart
Technical levels to watch
Reprinted from FXStreet,the copyright all reserved by the original author.
Disclaimer: The content above represents only the views of the author or guest. It does not represent any views or positions of FOLLOWME and does not mean that FOLLOWME agrees with its statement or description, nor does it constitute any investment advice. For all actions taken by visitors based on information provided by the FOLLOWME community, the community does not assume any form of liability unless otherwise expressly promised in writing.
FOLLOWME Trading Community Website: https://www.followme.com


Hot
No comment on record. Start new comment.