As Bitcoin Hits Record Highs, Volatility Picks Up - Chart

Bitcoin prices have been raging higher, but Monday has been a bit more slippery than some had anticipated.
The cryptocurrency was down about $2,100, or 6.5% on the day, now changing hands around $31,000.
However, at one point on Monday, the cryptocurrency was down more than $5,300 from Sunday’s close, or a decline of 16.2% at the session low.
After hitting its all-time high of roughly $34,800 on Sunday, bitcoin fell more than 20% at Monday’s low. Despite the growing popularity with bitcoin and other cryptocurrencies, that’s the type of volatility that we can see in the short term.
After breaking out over $24,000, I was looking for a move to $30,000.
With that price target being achieved and bitcoin wobbling a bit, what can investors expect now? Let’s look at the charts.
Trading Bitcoin
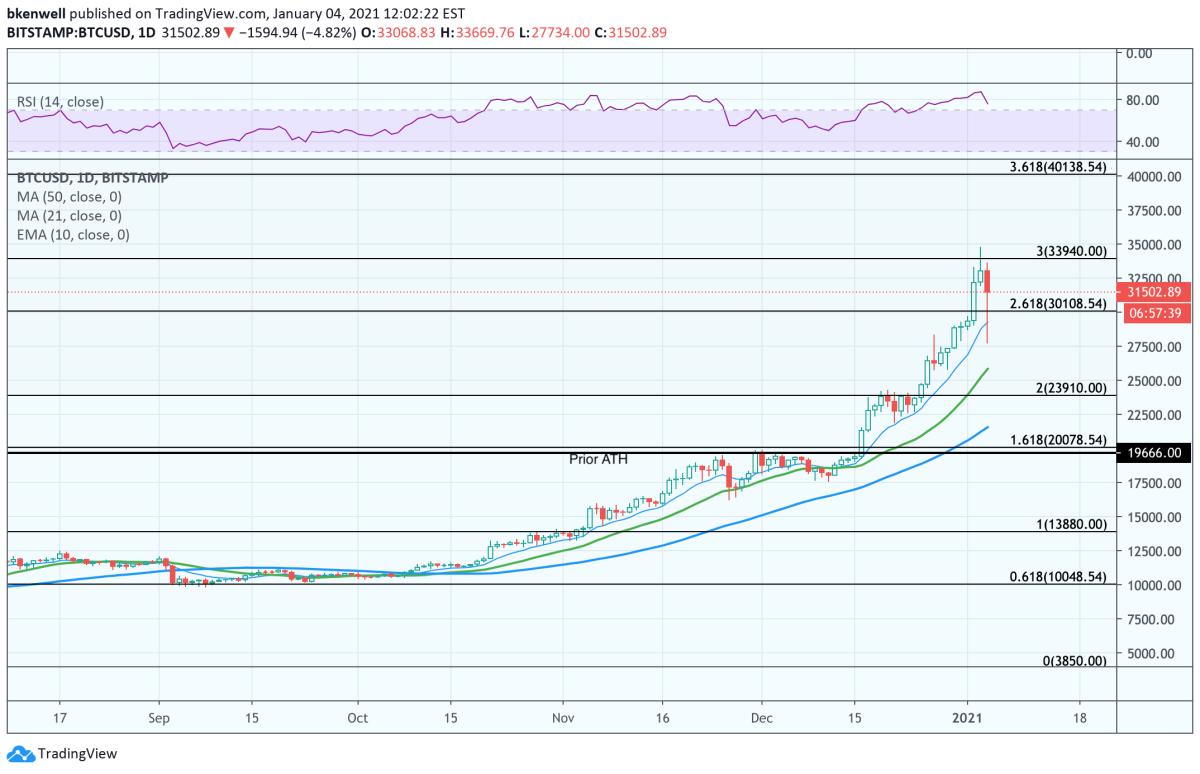
Daily chart of bitcoin.
Chart courtesy of TradingView.com
The one thing bulls and bears alike should love about bitcoin? The fact that it trades very technically.
Look at the way bitcoin traded up to the 161.8% extension and prior all-time high around $20,000. It respected these marks while trading sideways and consolidating the recent gains.
Then a quick two-day breakout sent shares to the two-times range extension near $23,900, where it again consolidated its gains.
I was hoping for a larger pullback - back toward $20,000 - but the 10-day moving average held as support and soon bitcoin was on the move again.
This time, the cryptocurrency rallied in 10 of 11 sessions. From the low to the high during that stretch, bitcoin racked up gains eclipsing 53%.
With a burst of volatility - and with the S&P 500 down more than 2% to start the year - where can bitcoin go from here?
Those who snapped up bitcoin when it was down 20% from the highs did a good job, as we’ve already had a strong bounce since.
If bitcoin takes out this week’s low at $27,734, it puts the 21-day moving average in play. Since bitcoin trades 24/7, some may prefer to use the 30-day moving average, which is currently right near that two-times range extension.
A retest of this breakout spot could be an excellent buying opportunity for investors and will put the cryptocurrency down about 31% from the highs.
On the upside, we cannot rule out a further push higher. In that event, look for a move above the all-time high at $34,800. A close above this level could put the 361.8% extension on the table, all the way up near $40,140.
I love that many of these significant extensions come into play near round levels, like $30,000 or $40,000. Let’s see if $40,000 is in the cards moving forward, with or without a pullback.
Reprinted from The Street,the copyright all reserved by the original author.
Disclaimer: The content above represents only the views of the author or guest. It does not represent any views or positions of FOLLOWME and does not mean that FOLLOWME agrees with its statement or description, nor does it constitute any investment advice. For all actions taken by visitors based on information provided by the FOLLOWME community, the community does not assume any form of liability unless otherwise expressly promised in writing.
FOLLOWME Trading Community Website: https://www.followme.com


Hot
No comment on record. Start new comment.