USD/JPY Price Analysis: Dives to fresh multi-month lows, closer to descending channel support

- USD/JPY witnessed some fresh selling on Monday and dived to fresh multi-month lows.
- The formation of descending channel points to a well-established downward trajectory.
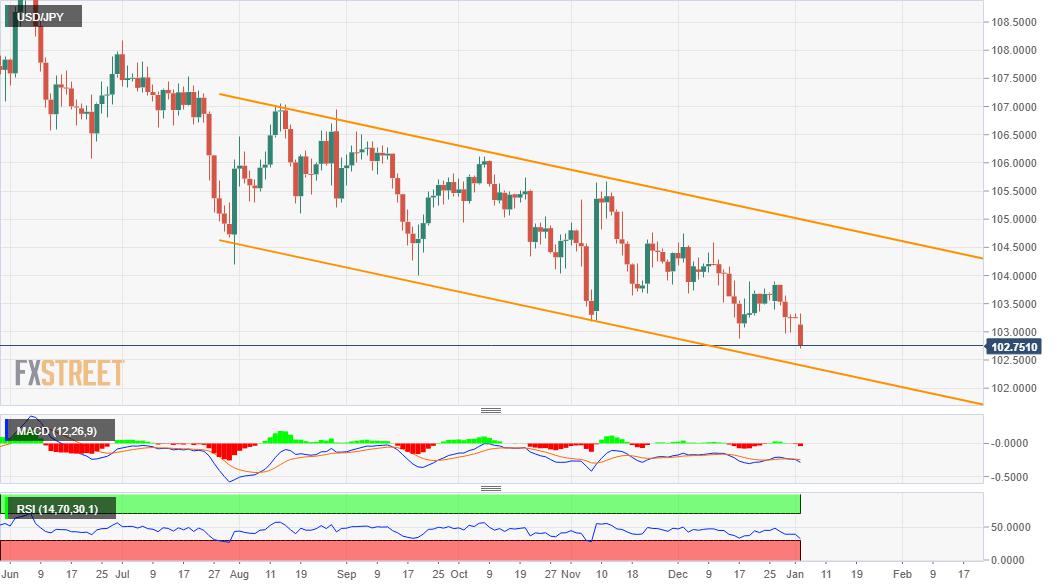
The USD/JPY pair continued losing ground through the first half of the European session and dropped to fresh multi-month lows, around the 102.70 region in the last hour. The downfall was exclusively sponsored by sustained US dollar selling.
Looking at the technical picture, the USD/JPY pair has been trending lower along a four-month-old downward sloping channel. This points to a well-established bearish trend and supports prospects for an extension of the ongoing downward trajectory.
That said, the prevalent risk-on environment might undermine the safe-haven Japanese yen and help limit losses for the USD/JPY pair. Hence, any further decline is more likely to find decent support near the lower boundary of the trend channel.
The mentioned support is currently pegged near 102.55 region and is closely followed by March daily closing lows, around the 102.35 level. Failure to defend the mentioned support levels will now be seen as a fresh trigger for bearish traders.
The USD/JPY pair might then turn vulnerable to break below the 102.00 round-figure mark and accelerate the fall further towards testing 2020 lows, around the 101.20-15 region.
On the flip side, the daily swing highs, around 103.30 area, now seems to have emerged as immediate strong resistance. A sustained move beyond might trigger some near-term short-covering move and push the USD/JPY pair further beyond the 104.00 mark.
The momentum could get extended towards the 104.70-75 supply zone before bulls eventually aim to reclaim the key 105.00 psychological mark. The latter coincides with the trend-channel resistance, which should act as a strong barrier for the USD/JPY pair.
USD/JPY daily chart
Technical levels to watch
Reprinted from FXStreet,the copyright all reserved by the original author.
Disclaimer: The content above represents only the views of the author or guest. It does not represent any views or positions of FOLLOWME and does not mean that FOLLOWME agrees with its statement or description, nor does it constitute any investment advice. For all actions taken by visitors based on information provided by the FOLLOWME community, the community does not assume any form of liability unless otherwise expressly promised in writing.
FOLLOWME Trading Community Website: https://www.followme.com


Hot
No comment on record. Start new comment.