WTI Price Analysis: Keeps bounce off 200-HMA despite downbeat Baker Hughes report

- WTI keeps upside break of 100-HMA and 61.8% Fibonacci retracement.
- Baker Hughes US Oil Rig Count grew 267 during the latest weekly release of 2020.
- Two US B52 bombers head to the Middle East to warn Iran.
- Two-week-old falling trend line on bulls’ radars, sellers have multiple barriers around 47.50/60.
WTI settles around $48.40 by the end of Wednesday’s trading. In doing so, the energy benchmark rose for the second consecutive day while paying a little heed to the weekly rig count data from the US.
Recently, Fox News came out with the update suggesting two B52 bombers heading towards the Middle East amid intensifying tension between America and Iran.
That said, the oil prices earlier cheered higher than previous and expected inventory data to stay positive beyond $48.00.
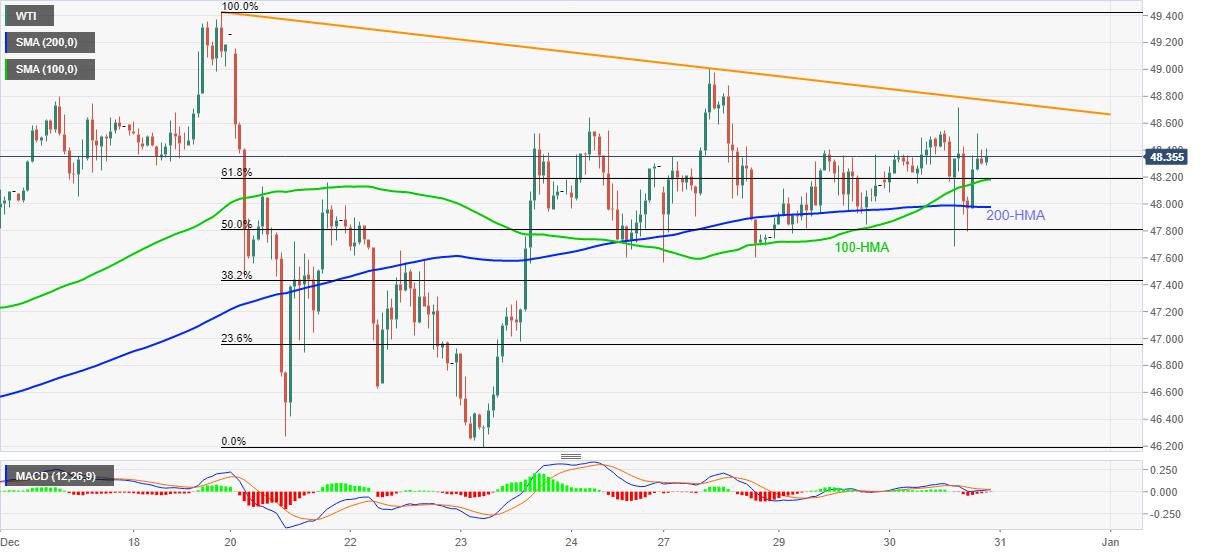
Technically, the commodity’s ability to stay beyond 100-HMA and 61.8% Fibonacci retracement of December 18-23 downside favor the bulls to eye a falling trend line from December 18, currently around $48.77.
It should, however, be noted that the multi-month high near $49.45 and the $50.00 will lure the energy bulls during the quote’s sustained run-up past-$48.77.
Meanwhile, a downside break of a confluence including 100-HMA and 61.8% Fibonacci retracement near $48.20 offers immediate strong support ahead of the 200-HMA level of $47.97.
Also likely to challenge the oil sellers are multiple highs and lows marked after December 22 around $47.60/50.
WTI hourly chart
Trend: Bullish
Reprinted from FXStreet,the copyright all reserved by the original author.
Disclaimer: The content above represents only the views of the author or guest. It does not represent any views or positions of FOLLOWME and does not mean that FOLLOWME agrees with its statement or description, nor does it constitute any investment advice. For all actions taken by visitors based on information provided by the FOLLOWME community, the community does not assume any form of liability unless otherwise expressly promised in writing.
FOLLOWME Trading Community Website: https://www.followme.com


Hot
No comment on record. Start new comment.