Patterns: DOLLAR.IDX/USD, GBR.IDX/GBP

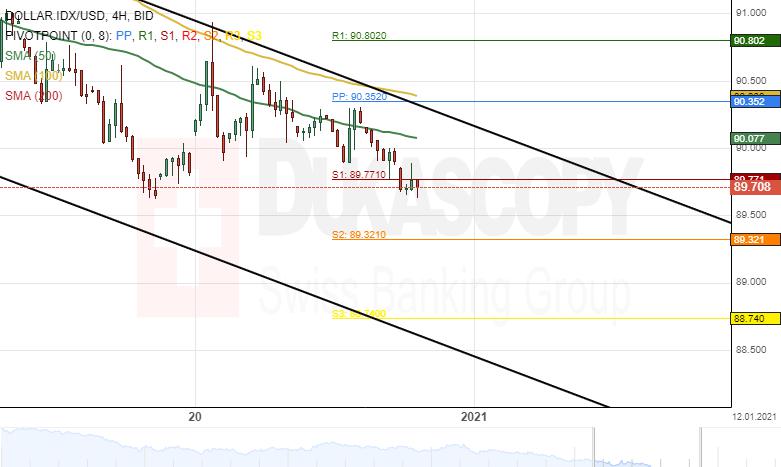
DOLLAR.IDX/USD 4H Chart: Decline likely to continue
The dollar index, which measures the US Dollar against a basket of major currencies, has declined by 1.08% since last week's trading sessions. The index was pressured lower by the 100– period simple moving average.
All things being equal, the DOLLAR.IDX/USD pair could continue to edge lower in a descending channel pattern during the following trading sessions. The possible target for bears would be near the 88.50 area.
However, the weekly support level at 89.32 could provide a barrier for bearish traders in the shorter term.
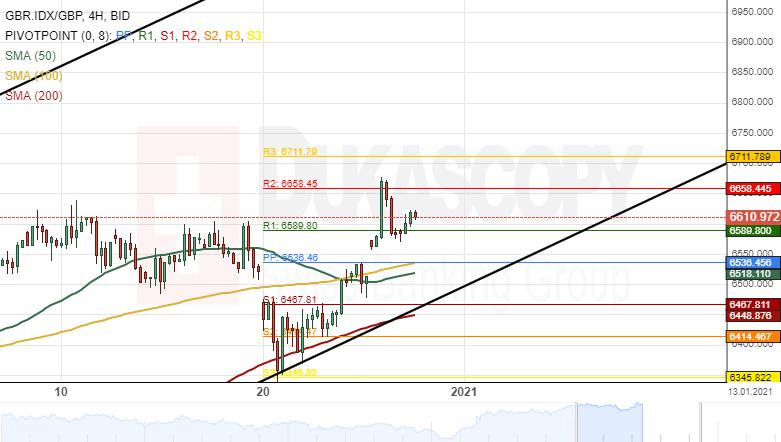
GBR.IDX/GBP 4H Chart: Bulls could prevail
The UK100, which measures the best 100 performing shares from the London Stock Exchange, has surged by 5.58% since December 21. The index tested the 6650.4 level on December 29.
As for the near future, the GBR.IDX/GBP pair could continue to trend bullish during the following trading sessions. The possible target for bulls would be near the 6800.0 area.
However, the weekly resistance level at 6711.7 could provide resistance for bullish traders within this week's trading sessions.
Reprinted from FXStreet,the copyright all reserved by the original author.
Disclaimer: The content above represents only the views of the author or guest. It does not represent any views or positions of FOLLOWME and does not mean that FOLLOWME agrees with its statement or description, nor does it constitute any investment advice. For all actions taken by visitors based on information provided by the FOLLOWME community, the community does not assume any form of liability unless otherwise expressly promised in writing.
FOLLOWME Trading Community Website: https://www.followme.com


Hot
No comment on record. Start new comment.