EUR/JPY Price Analysis: Sits near multi-month tops, around 127.00 mark

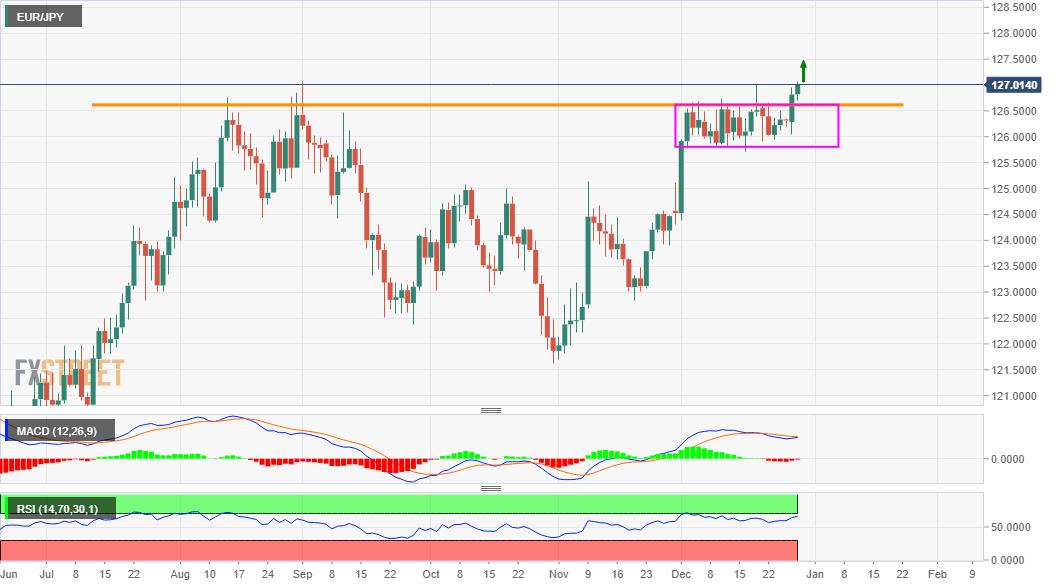
- EUR/JPY built on the overnight bullish breakout momentum and climbed to multi-month tops.
- The set-up seems tilted in favour of bullish trades and supports prospects for additional gains.
- Meaningful dips below the 126.70 resistance breakpoint might be seen as a buying opportunity.
The EUR/JPY cross added to the previous day's strong positive move and traded with a positive bias through the mid-European session on Tuesday. The momentum pushed the cross to the highest level since early March, though bulls struggled to find acceptance above the 127.00 mark.
That said, the EUR/JPY cross has already confirmed a bullish breakout through a near one-month-old trading range and seems poised to appreciate further. The constructive outlook is further reinforced by bullish oscillators, which are still far from being in the overbought territory.
Some follow-through buying beyond the 127.00-127.10 region will add credence to the bullish bias and lift the EUR/JPY cross further towards the next major hurdle near the 127.40 region. Above the mentioned level, bulls are likely to aim to reclaim the 128.00 round-figure mark.
On the flip side, any meaningful pullback below the 126.70 trading range breakpoint might now be seen as a buying opportunity and remain limited near the 126.25 horizontal support. This is closely followed by the 126.00 mark, which should act as a strong base for the EUR/JPY cross.
Only a sustained weakness below the mentioned support levels will negate prospects for any further gains and prompt some aggressive technical selling. The EUR/JPY cross might then accelerate the fall further towards the key 125.00 psychological mark en-route the 124.40 support zone.
EUR/JPY daily chart
Technical levels to watch
Reprinted from FXStreet,the copyright all reserved by the original author.
Disclaimer: The content above represents only the views of the author or guest. It does not represent any views or positions of FOLLOWME and does not mean that FOLLOWME agrees with its statement or description, nor does it constitute any investment advice. For all actions taken by visitors based on information provided by the FOLLOWME community, the community does not assume any form of liability unless otherwise expressly promised in writing.
FOLLOWME Trading Community Website: https://www.followme.com


Hot
No comment on record. Start new comment.