AUD/JPY Price Analysis: Hits highest since April 2019

- AUD/JPY hits multi-month highs on US stimulus.
- The pair eyes key SMA hurdle, as the weekly chart favors a continued rally.
Buoyed at least in part by President Trump's signing of the coronavirus stimulus package, AUD/JPY reached 20-month highs on Monday.
The currency pair traded at 78.88, the highest level since late April 2019, having picked up a bid at 78.54 in early Asia.
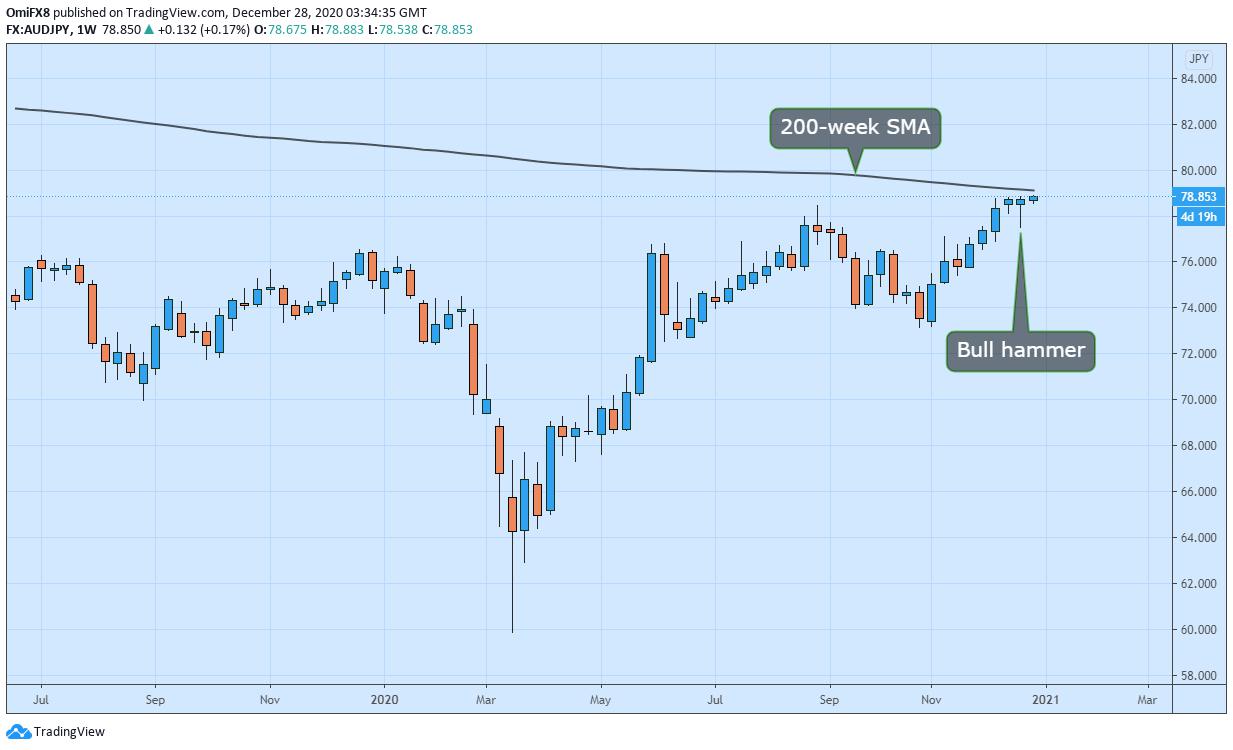
According to the last week's bullish hammer candle, the path of least resistance is to the higher side. The above-50 readings on the daily and weekly chart relative strength indices also indicate a bullish bias.
The immediate resistance is located at 79.12 (200-week Simple Moving Average), followed by 80.72 (April 2019 high). Meanwhile, 77.49 (last week's low) is the level to beat for the sellers.
Weekly chart
Trend: Bullish
Technical levels
Reprinted from FXStreet,the copyright all reserved by the original author.
Disclaimer: The content above represents only the views of the author or guest. It does not represent any views or positions of FOLLOWME and does not mean that FOLLOWME agrees with its statement or description, nor does it constitute any investment advice. For all actions taken by visitors based on information provided by the FOLLOWME community, the community does not assume any form of liability unless otherwise expressly promised in writing.
FOLLOWME Trading Community Website: https://www.followme.com


Hot
No comment on record. Start new comment.