Gold Price Analysis: XAU/USD’s dead cat bounce could threaten robust $1818 cap – Confluence Detector

Gold has paused its two-day sell-off on Wednesday, although the risks remain skewed to the downside heading into the economic data dump slated for release from the US docket.
Investors sold-off the safe-haven gold alongside the US dollar amid a risk-on market profile, driven by coronavirus vaccine progress, Biden transition and fiscal stimulus hopes.
Reduced US pollical uncertainty and expectations of swifter economic rebound on strong PMIs have dashed hopes of additional stimulus, weighing negatively on the yellow metal.
How is gold positioned technically ahead of key US data?
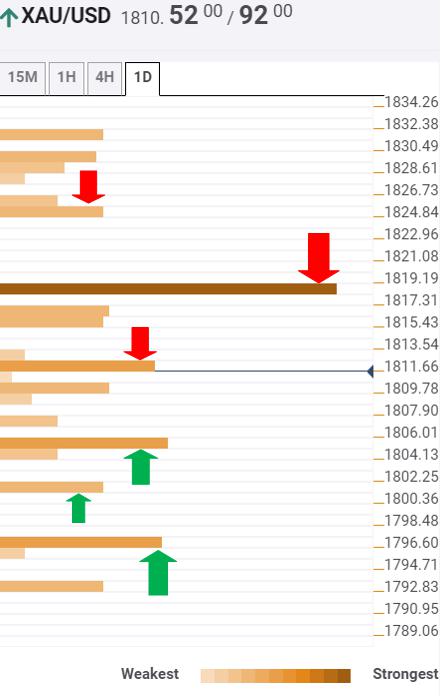
The Technical Confluences Indicator shows that the XAU/USD pair faces stiff resistance around $1812, where the SMA5 four-hour and Bollinger Band one-hour Middle converge.
The next relevant upside target is seen at $1816, which is the intersection of the Fibonacci 38.2% one-day and SMA100 15-minutes.
A sustained break above the strong cap at $1818 is needed to extend the recovery momentum from four-month troughs. That level is the meeting point of the pivot point one-month S2 and Bollinger Band one-day Lower.
Further up, the Fibonacci 61.8% one-day at $1824 could guard the upside.
On the flip side, a robust cushion awaits at $1805, which is the convergence of the pivot point one-week S3 and Bollinger Band 15-minutes Lower.
The four-month low at $1800.40 will be the next target for the sellers.
Fierce support at $1796 remains at risk if the selling pressure intensifies. At that level, the SMA200 one-day coincides with the Bollinger Band four-hour Lower.
Here is how it looks on the tool
About Confluence Detector
The TCI (Technical Confluences Indicator) is a tool to locate and point out those price levels where there is a congestion of indicators, moving averages, Fibonacci levels, Pivot Points, etc. Knowing where these congestion points are located is very useful for the trader, and can be used as a basis for different strategies.
Source: https://www.fxstreet.com/news/...
Reprinted from FXStreet,the copyright all reserved by the original author.
Edited 25 Nov 2020, 12:14
Disclaimer: The content above represents only the views of the author or guest. It does not represent any views or positions of FOLLOWME and does not mean that FOLLOWME agrees with its statement or description, nor does it constitute any investment advice. For all actions taken by visitors based on information provided by the FOLLOWME community, the community does not assume any form of liability unless otherwise expressly promised in writing.
FOLLOWME Trading Community Website: https://www.followme.com


Hot
No comment on record. Start new comment.