GBP/USD Price Analysis: 100-bar SMA favors attempts to regain 1.3000

- GBP/USD remains lackluster despite staying mildly positive beyond 1.2900.
- Sustained bounce off 100-bar SMA, normal RSI conditions favor the bulls.
- The monthly horizontal line adds to the upside barriers.
GBP/USD seesaws between 1.2918 and 1.2922 during the pre-Tokyo open Asian session on Thursday. The Cable successfully recovered from 100-bar SMA the previous day, following Tuesday’s pullback from 200-bar SMA.
The upside momentum also takes clues from the absence of overbought RSI conditions, which in turn suggest the quote’s additional rise.
However, buyers are waiting for a clear break above 1.2930 to escalate the recovery moves toward the 1.3000 round-figure comprising 200-bar SMA.
Also challenging the GBP/USD bulls is a horizontal line around 1.3010 that comprising multiple levels marked since September 08.
Meanwhile, a downside break of 100-bar SMA, at 1.2868 now, can aim for the September 30 low near 1.2800.
In a case where the GBP/USD bears remain in power below 1.2800, the last month’s low near 1.2715 will be on their radar.
GBP/USD four-hour chart
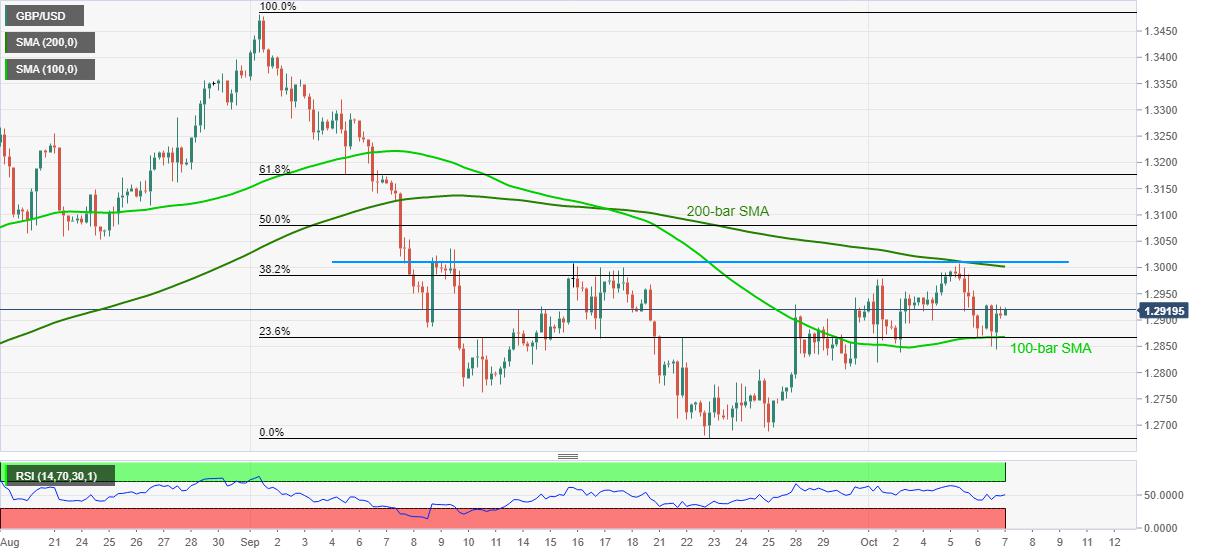
Trend: Further recovery expected
Reprinted from FXStreet,the copyright all reserved by the original author.
Disclaimer: The content above represents only the views of the author or guest. It does not represent any views or positions of FOLLOWME and does not mean that FOLLOWME agrees with its statement or description, nor does it constitute any investment advice. For all actions taken by visitors based on information provided by the FOLLOWME community, the community does not assume any form of liability unless otherwise expressly promised in writing.
FOLLOWME Trading Community Website: https://www.followme.com


Hot
-THE END-