EUR/USD Price Analysis: Weekly indicators turn bearish

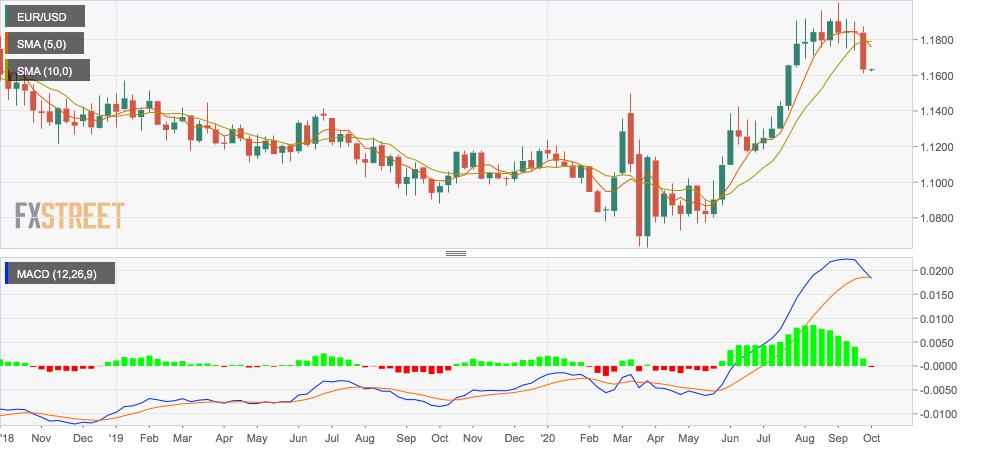
- EUR/USD's weekly MACD has turned bearish for the first since May.
- Key SMAs have rolled over in favor of the bears.
EUR/USD could extend last week's 1.77% decline, as crucial weekly chart indicators are now reporting bearish conditions.
The MACD histogram, which gauges trend strength and trend changes, has crossed below zero, indicating a bullish-to-bearish trend change. The index has turned negative for the first time since May.
Further, the 5- and 10-week simple moving averages (SMAs) have produced a bearish crossover for the first time since January.
As such, the pair is likely to test the former resistance-turned-support of 1.1495 (March high).
The pair is currently trading at 1.1632, having declined from 1.1872 to 1.1612 last week.
A close above last week's high of 1.1872 is needed to invalidate the bearish bias.
Weekly chart
Trend: Bearish
Technical levels
Reprinted from FXStreet,the copyright all reserved by the original author.
Disclaimer: The content above represents only the views of the author or guest. It does not represent any views or positions of FOLLOWME and does not mean that FOLLOWME agrees with its statement or description, nor does it constitute any investment advice. For all actions taken by visitors based on information provided by the FOLLOWME community, the community does not assume any form of liability unless otherwise expressly promised in writing.
FOLLOWME Trading Community Website: https://www.followme.com


Hot
-THE END-