AUD/JPY Price Analysis: Bears looking for monthly weekly and daily bearish confluence

- AUD/JPY is an attractive short below the daily structure.
- Currently, the stars do not quite align across all time frames from a top-down market structure analysis.
The Monthly is bearish and is looking as though it wants to form a head and shoulders.
The weekly is proving that there is resistance that first needs to hold the bullish commitments at this juncture.
The daily chart has a strong bullish bias while holding above a strong support structure along with the ascending trendline support.
Monthly chart
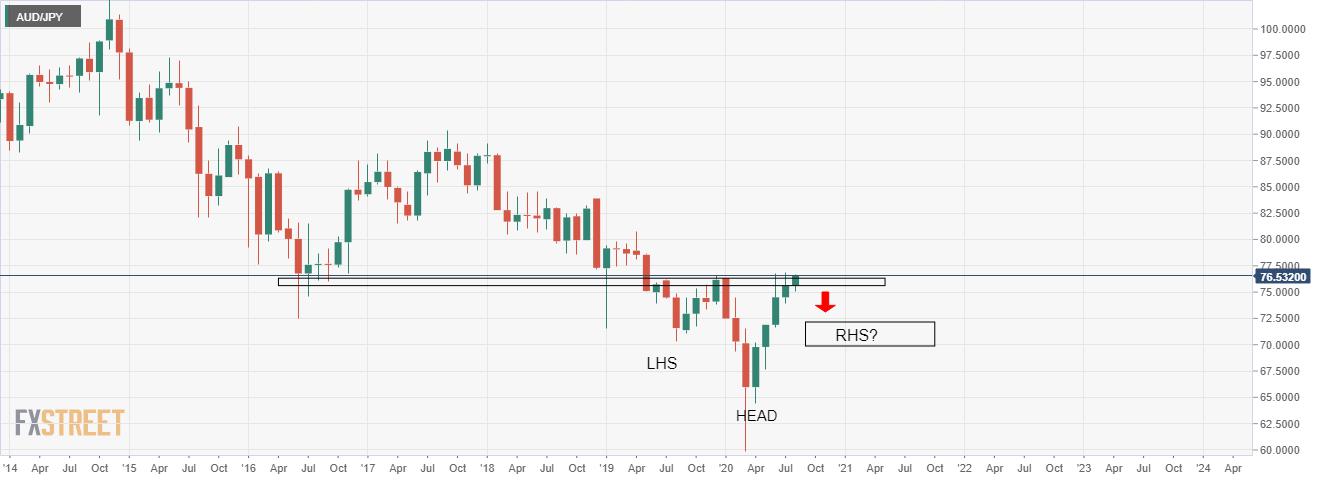
The above chart shows a potential reversal head and shoulders pattern in the making, offering downside target opportunities for the bears.
Weekly chart
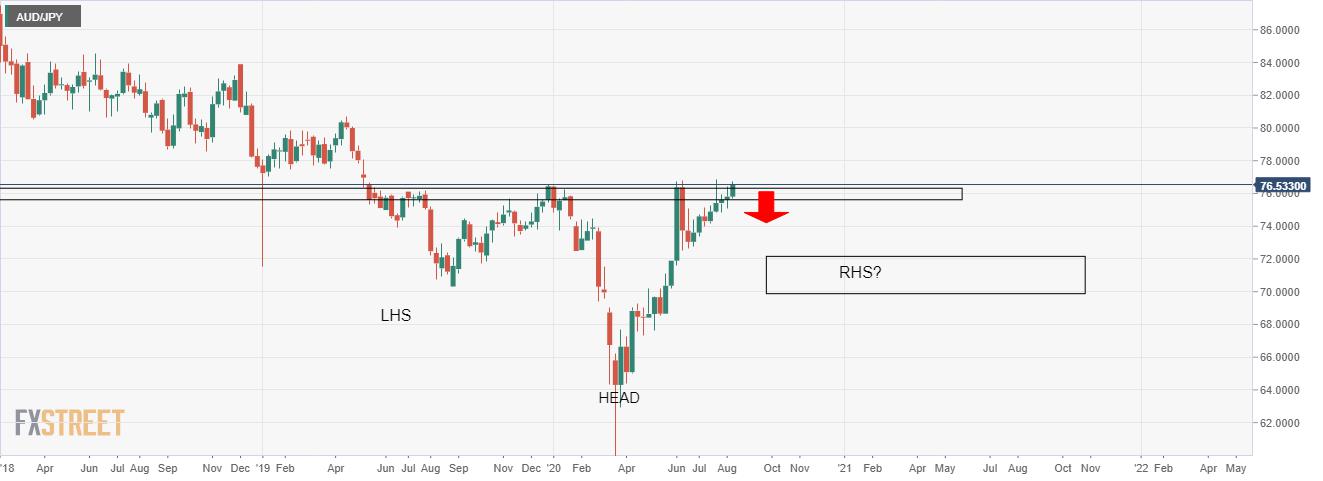
The weekly chart is showing that the bulls are trying for a second attempt a the resistance. Should they fail, the prospects for the head and shoulders are sound.
Daily chart
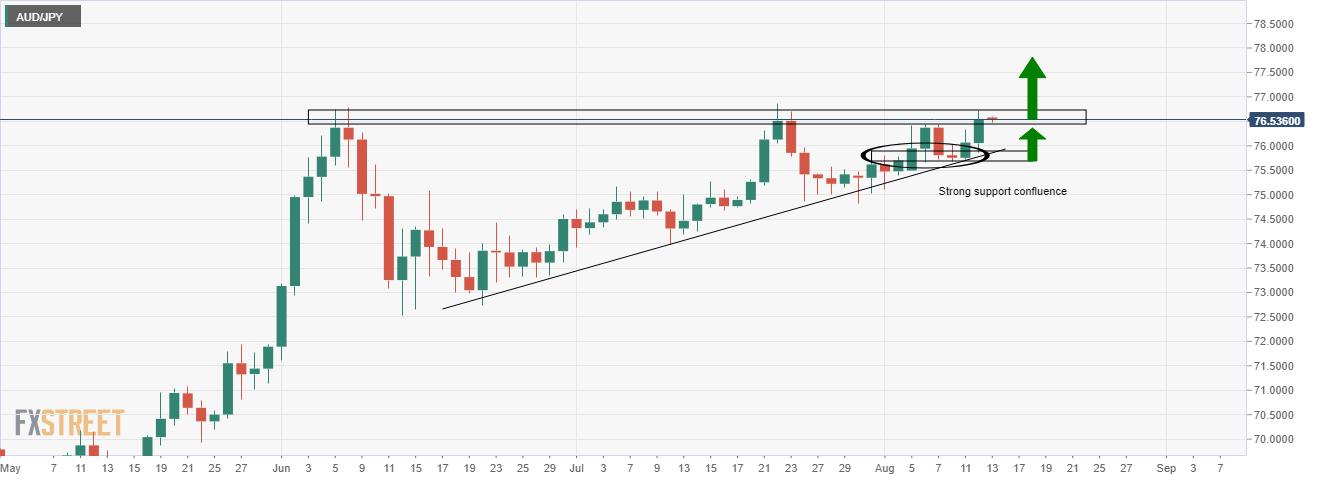
The daily support structure is a confluence of higher lows, the support trendline and a restest of the structure which confirms a bullish bias.
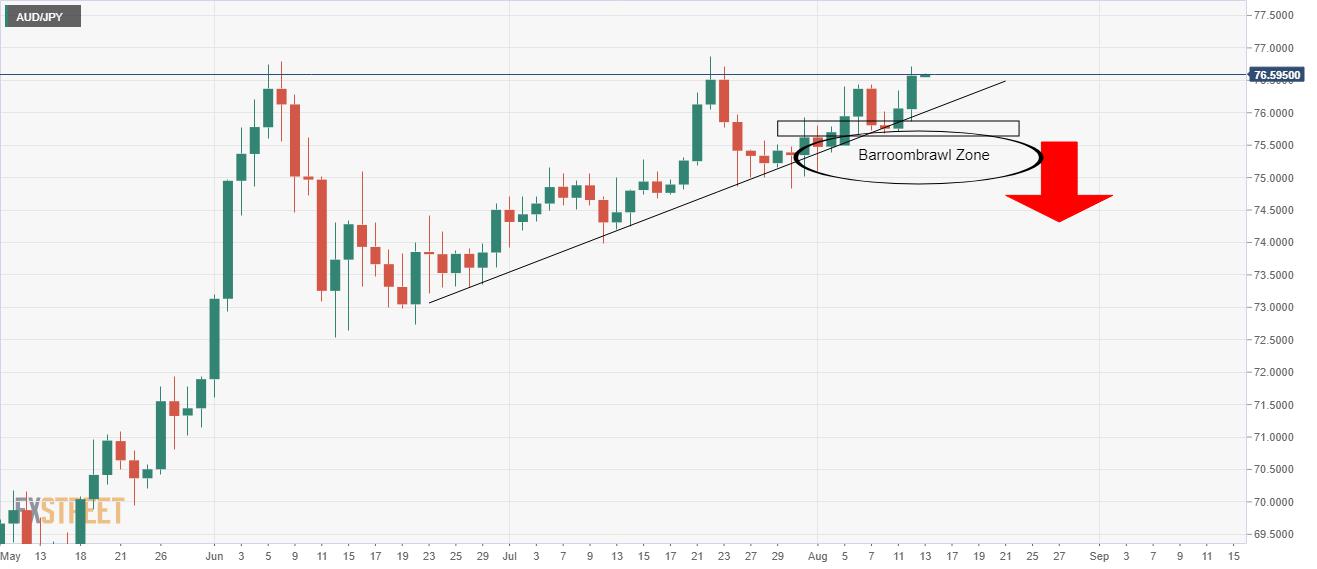
However, should the same confluence breakdown, then bears will be looking to take over in the barroom brawl zone and a shorting opportunity on a retest of broken support structure turned resistance.
Reprinted from FXStreet,the copyright all reserved by the original author.
Disclaimer: The content above represents only the views of the author or guest. It does not represent any views or positions of FOLLOWME and does not mean that FOLLOWME agrees with its statement or description, nor does it constitute any investment advice. For all actions taken by visitors based on information provided by the FOLLOWME community, the community does not assume any form of liability unless otherwise expressly promised in writing.
FOLLOWME Trading Community Website: https://www.followme.com


Hot
-THE END-