Gold technical analysis: Looks heavy with signs of indecision on the daily chart

- Gold could slip into losses as technical charts are indicating the recovery rally has run out of steam.
- The market sentiment is still quite bearish as the metal is struggling despite US-China political tensions.
Gold is currently reporting marginal gains, but will likely come under pressure during the day ahead, according to technical charts.
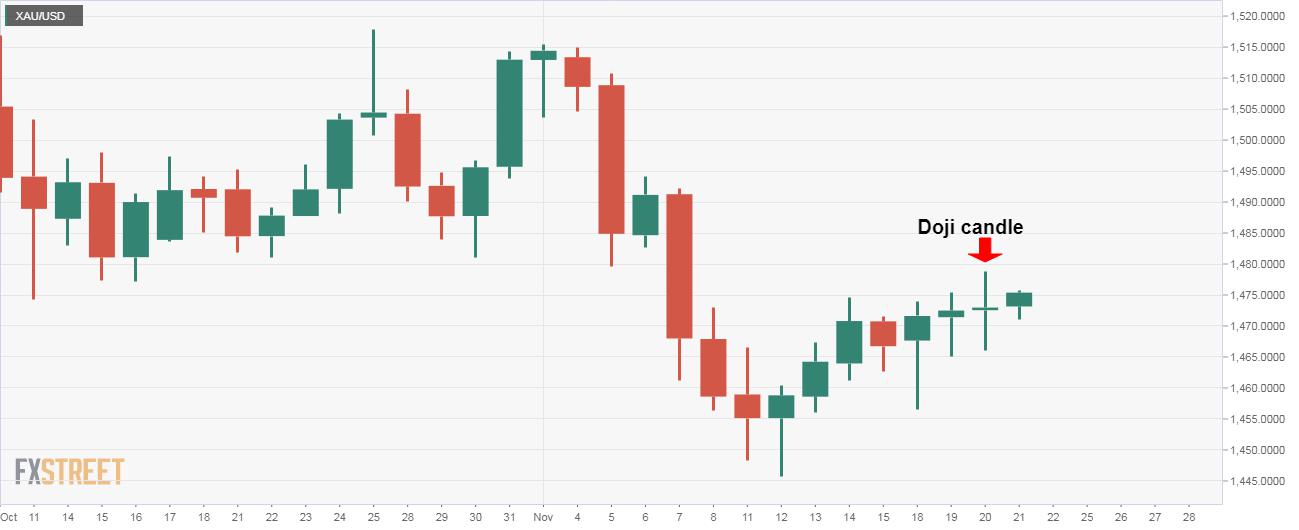
The yellow metal witnessed a two-way business for the second day on Wednesday. The resulting Doji candle indicates the bounce from recent lows near $1,445 has run out of steam.
As a result, a pullback could be in the offing. Note that the metal is struggling to post gains despite the political friction between the US and China and fading trade optimism.
The US 10-year treasury yield is also losing ground, currently trading at 1.724% - the lowest level since Nov. 4. Notably, the yield has shed more than 20 basis points in the last two weeks.
Even so, gold is having a tough time scoring convincing gains. It clearly indicates the gold market sentiment is still bearish.
A break below the daily low of $1,471 looks likely and could pave the way for a deeper drop to $1,464 and $1,456. On the higher side, a daily close above $1,478 is needed to invalidate the bearish setup.
Daily chart
Trend: Bearish
Technical levels
Reprinted from FXStreet,the copyright all reserved by the original author.
Disclaimer: The content above represents only the views of the author or guest. It does not represent any views or positions of FOLLOWME and does not mean that FOLLOWME agrees with its statement or description, nor does it constitute any investment advice. For all actions taken by visitors based on information provided by the FOLLOWME community, the community does not assume any form of liability unless otherwise expressly promised in writing.
FOLLOWME Trading Community Website: https://www.followme.com


Hot
No comment on record. Start new comment.