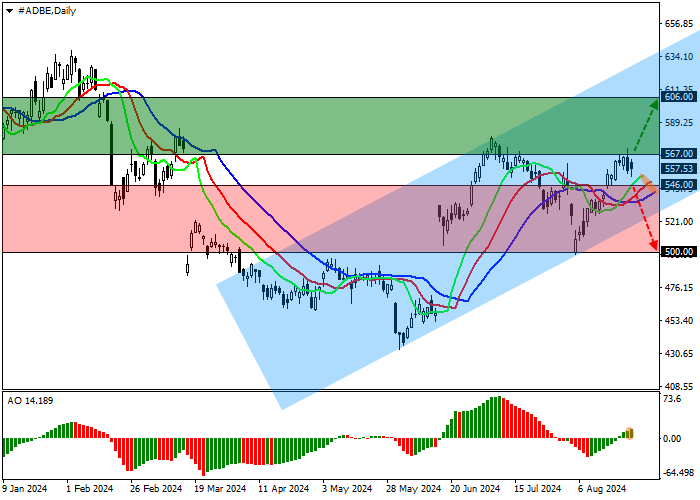
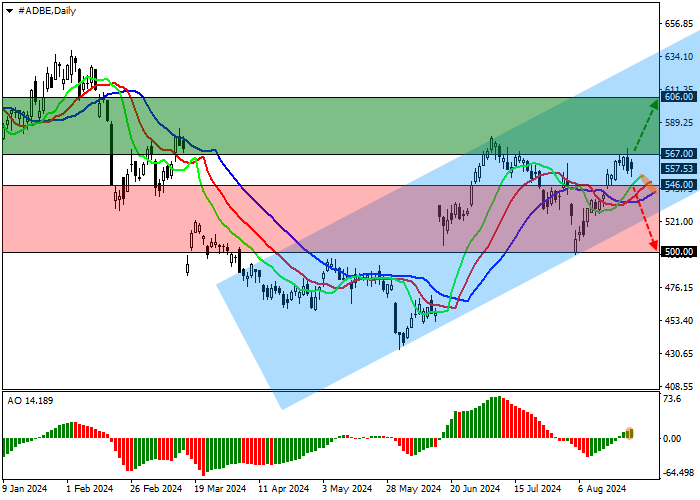
Shares of Adobe Inc., a leading American software developer, are trading in a corrective trend at 557.00.
On the daily chart, the price is rising, being above the support level of a wide ascending channel with dynamic boundaries of 634.00–500.00.
On the four-hour chart, the dynamics may continue, as the quotes are approaching the high of 577.00 of July 5, consolidation above which will allow them to reach the year’s high of 630.00. The key support level of the channel is 530.00.
Technical indicators have given a buy signal: the EMA fluctuation range on the Alligator indicator is expanding in the direction of growth, and the AO histogram is forming ascending bars in the buy zone.
Trading tips
Long positions may be opened after the price grows and consolidates above 567.00, with the target at 606.00. Stop loss — 555.00. Implementation period: 7 days or more.
Short positions may be opened after the price declines and consolidates below 546.00, with the target at 500.00. Stop loss — 560.00.



 No comments yet. Be the first to share your view.