SPDR Energy Select Sector ( $XLE) Found Buyers at the Blue Box Area as Expected.

Hello everyone. In today’s article, we will look at the past performance of the 4H Hour Elliott Wave chart of SPDR Energy Select Sector ($XLE). The rally from 1.18.2024 low at $78.98 unfolded as 5 waves impulse. We expected the pullback to unfold in 3 swings and find buyers again. We will explain the structure & forecast below:
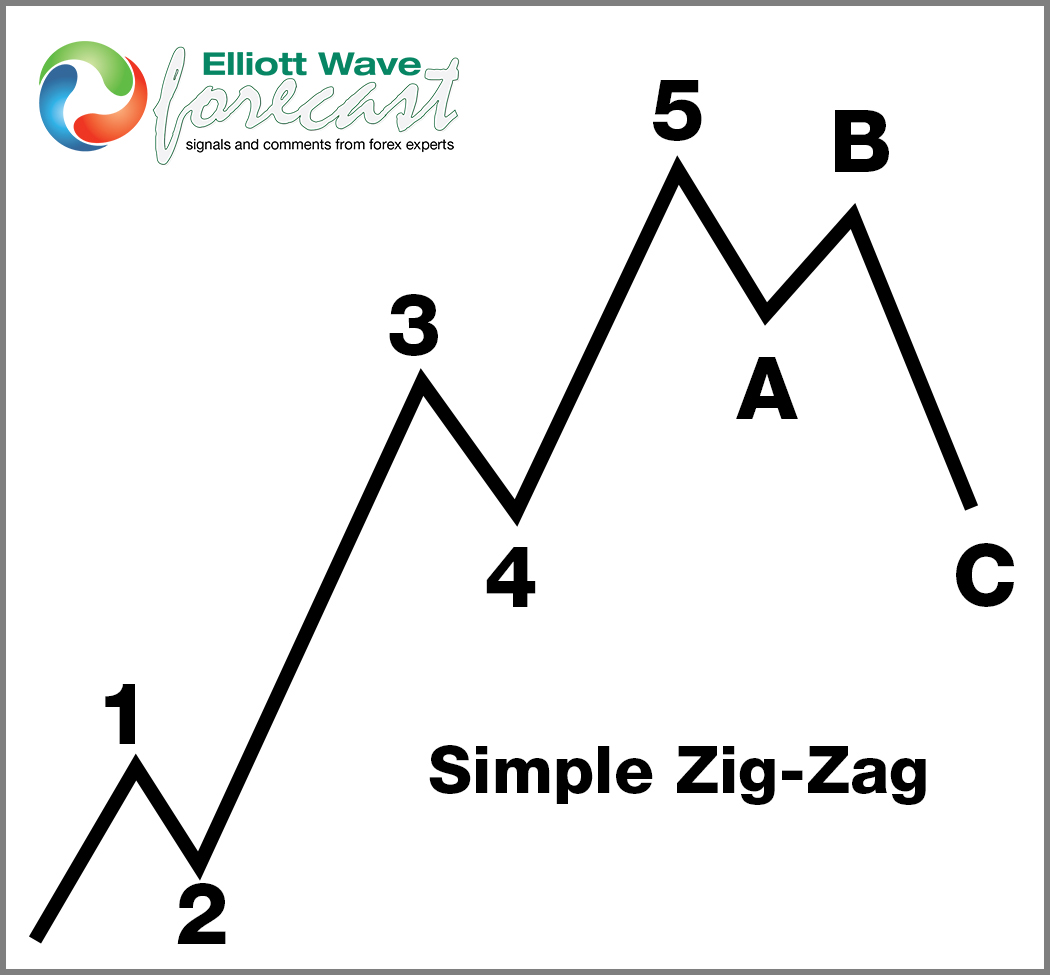
5 Wave Impulse Structure + ABC correction
$XLE 4H Elliott Wave Chart 5.02.2024:
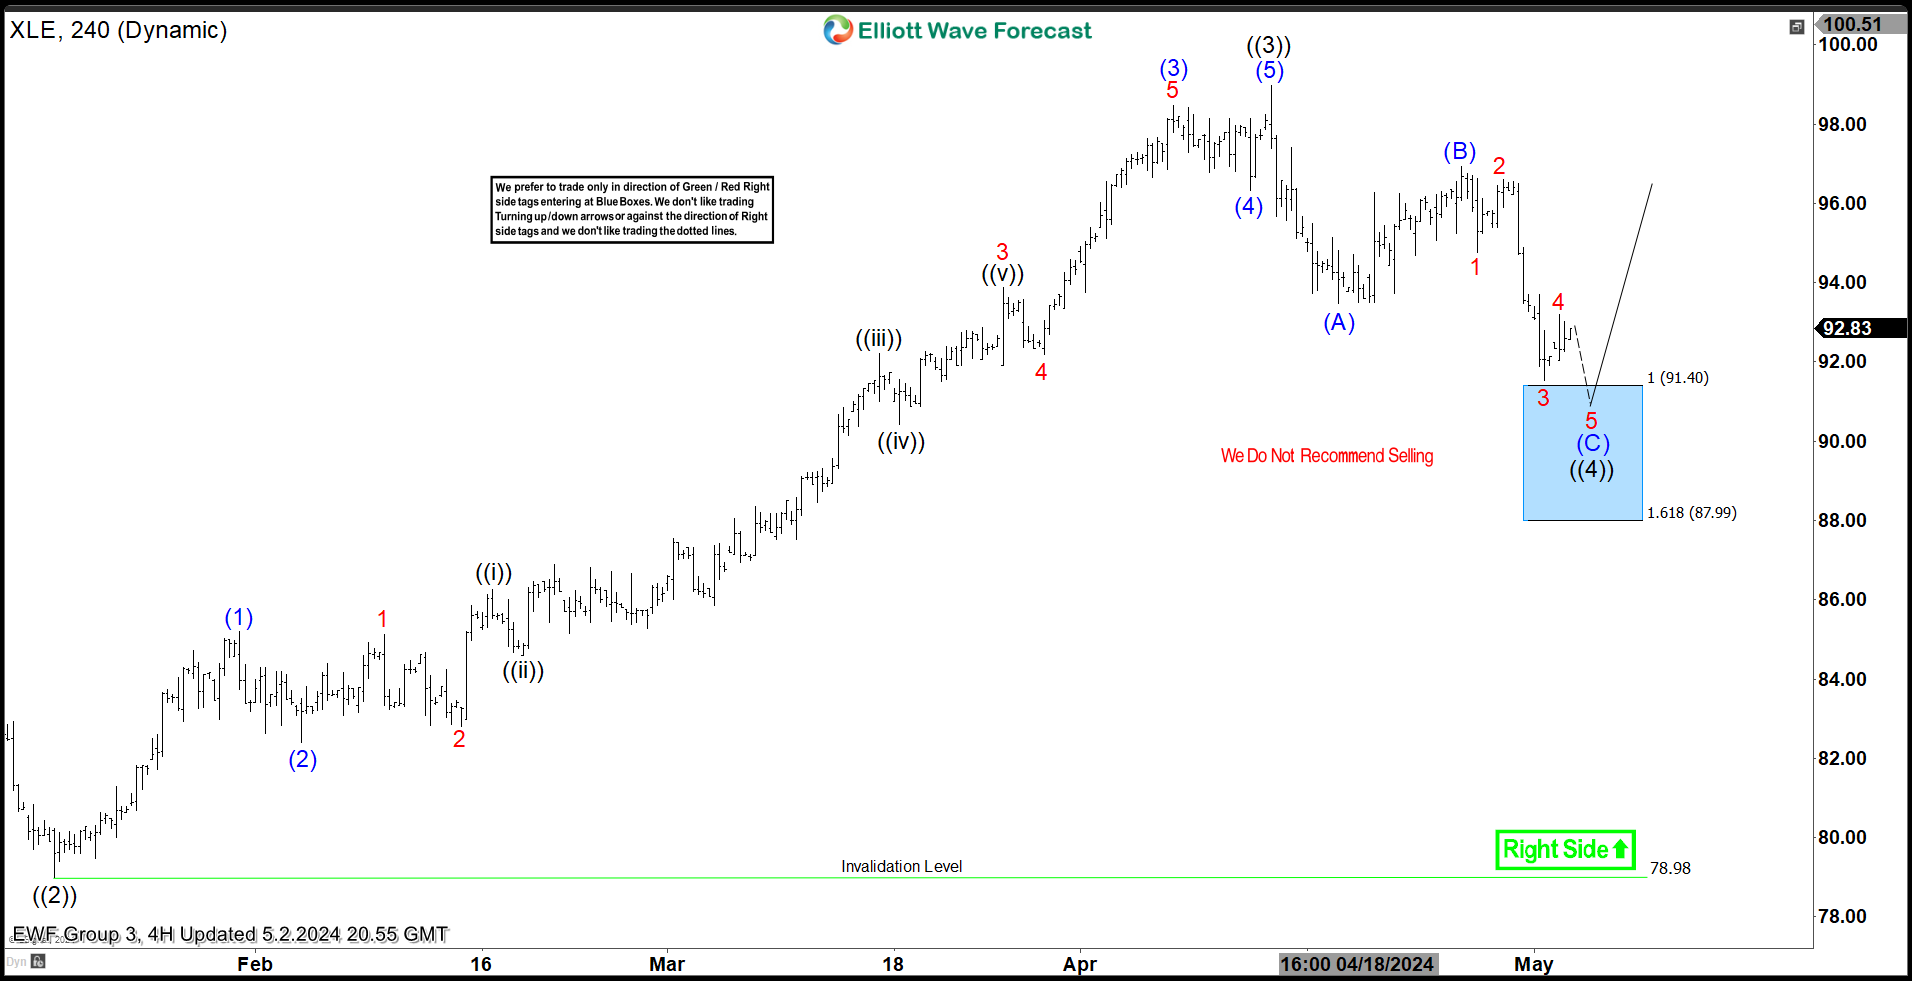 Here is the 4H Elliott Wave count from 5.02.2024. We expected the pullback to find buyers after a 3 swings Zig-Zag correction (ABC) at the blue box area at 91.40 – 87.99.
$XLE 4H Elliott Wave Chart 5.06.2024:
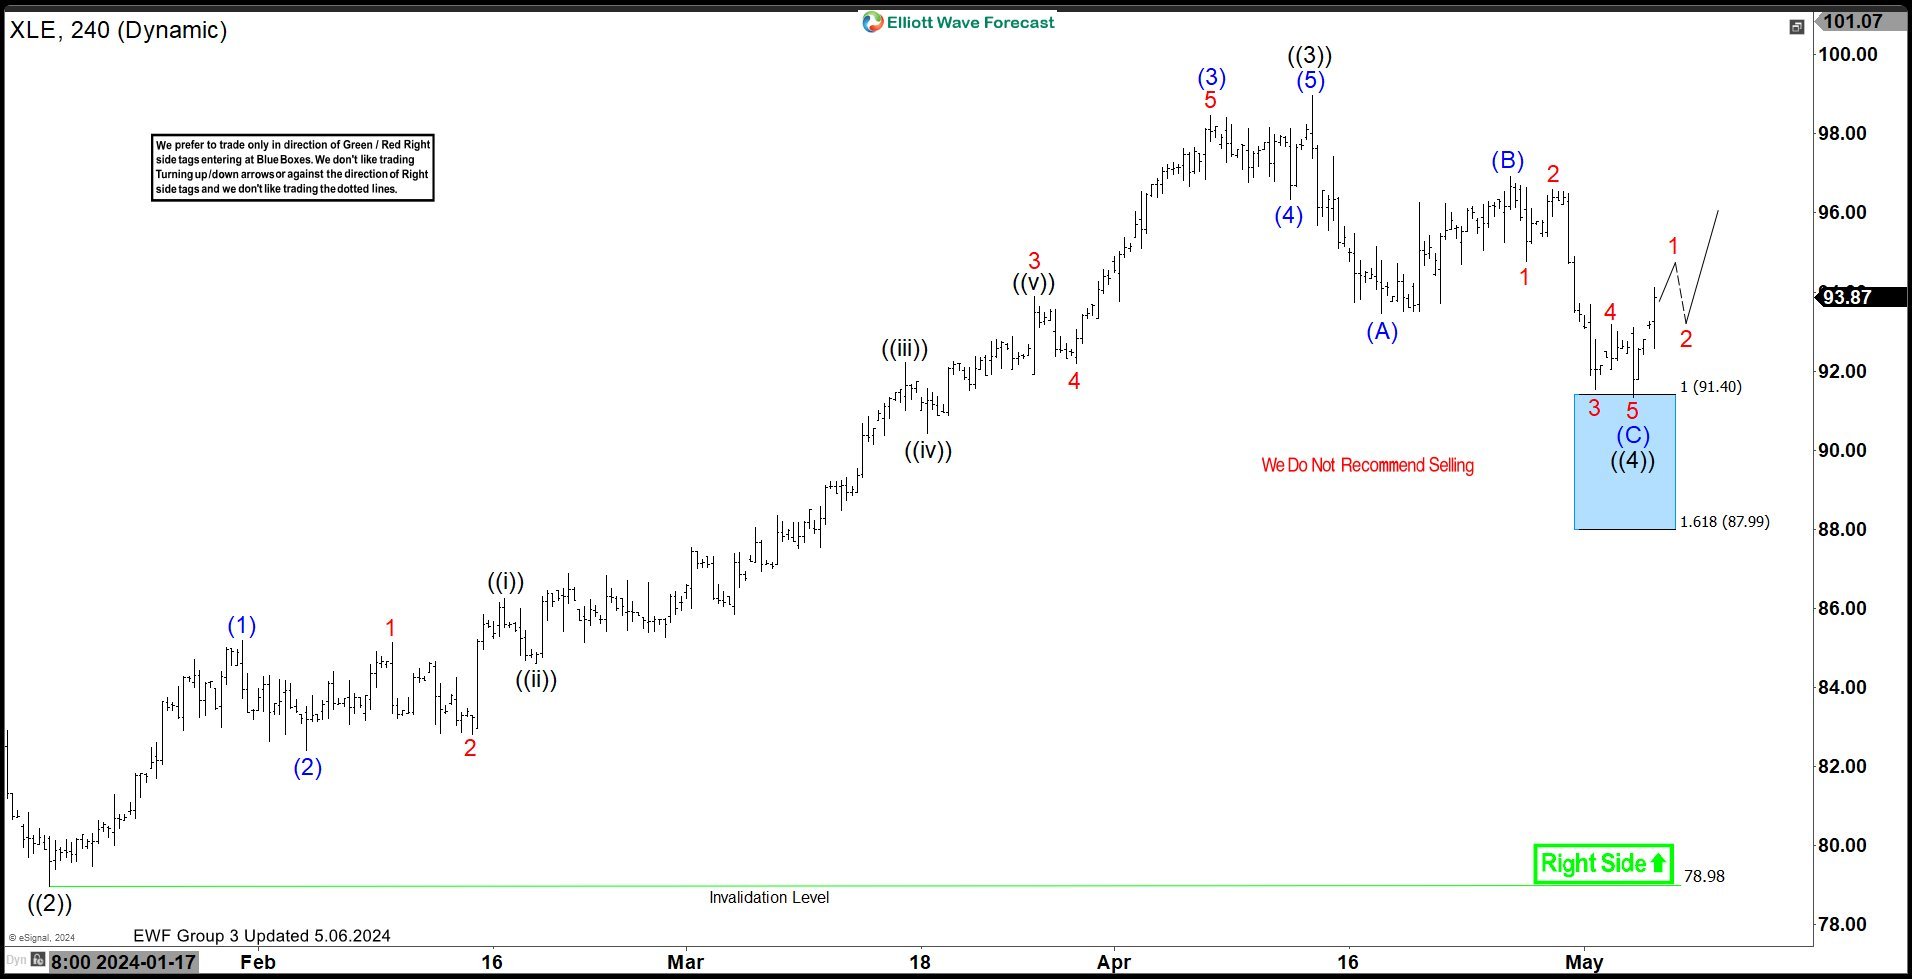 Here is the latest 4H update from 5.06.2024 showing the bounce taking place as expected. The ETF has reacted higher from the blue box area allowing longs to get risk free. The ETF is expected to remain supported with a target area towards $101 – 104 before another pullback can happen.
Disclaimer: The content above represents only the views of the author or guest. It does not represent any views or positions of FOLLOWME and does not mean that FOLLOWME agrees with its statement or description, nor does it constitute any investment advice. For all actions taken by visitors based on information provided by the FOLLOWME community, the community does not assume any form of liability unless otherwise expressly promised in writing.
FOLLOWME Trading Community Website: https://www.followme.com


Hot
No comment on record. Start new comment.