© 2026 Followme
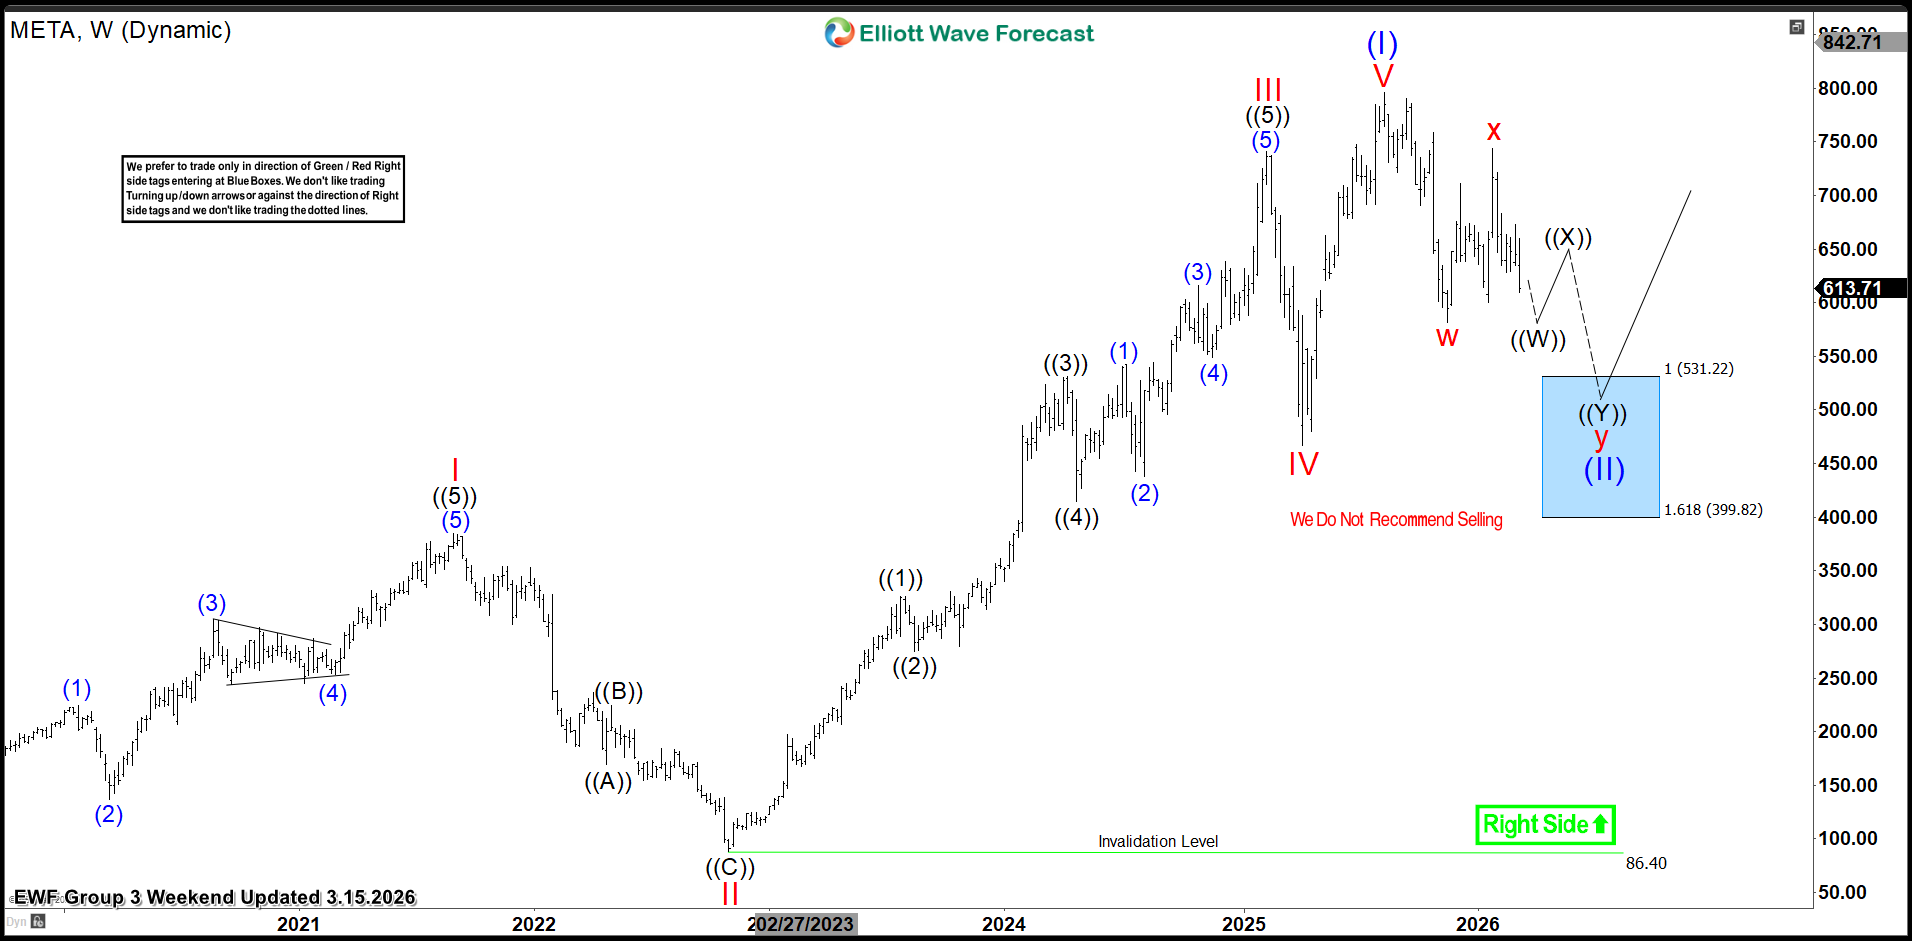
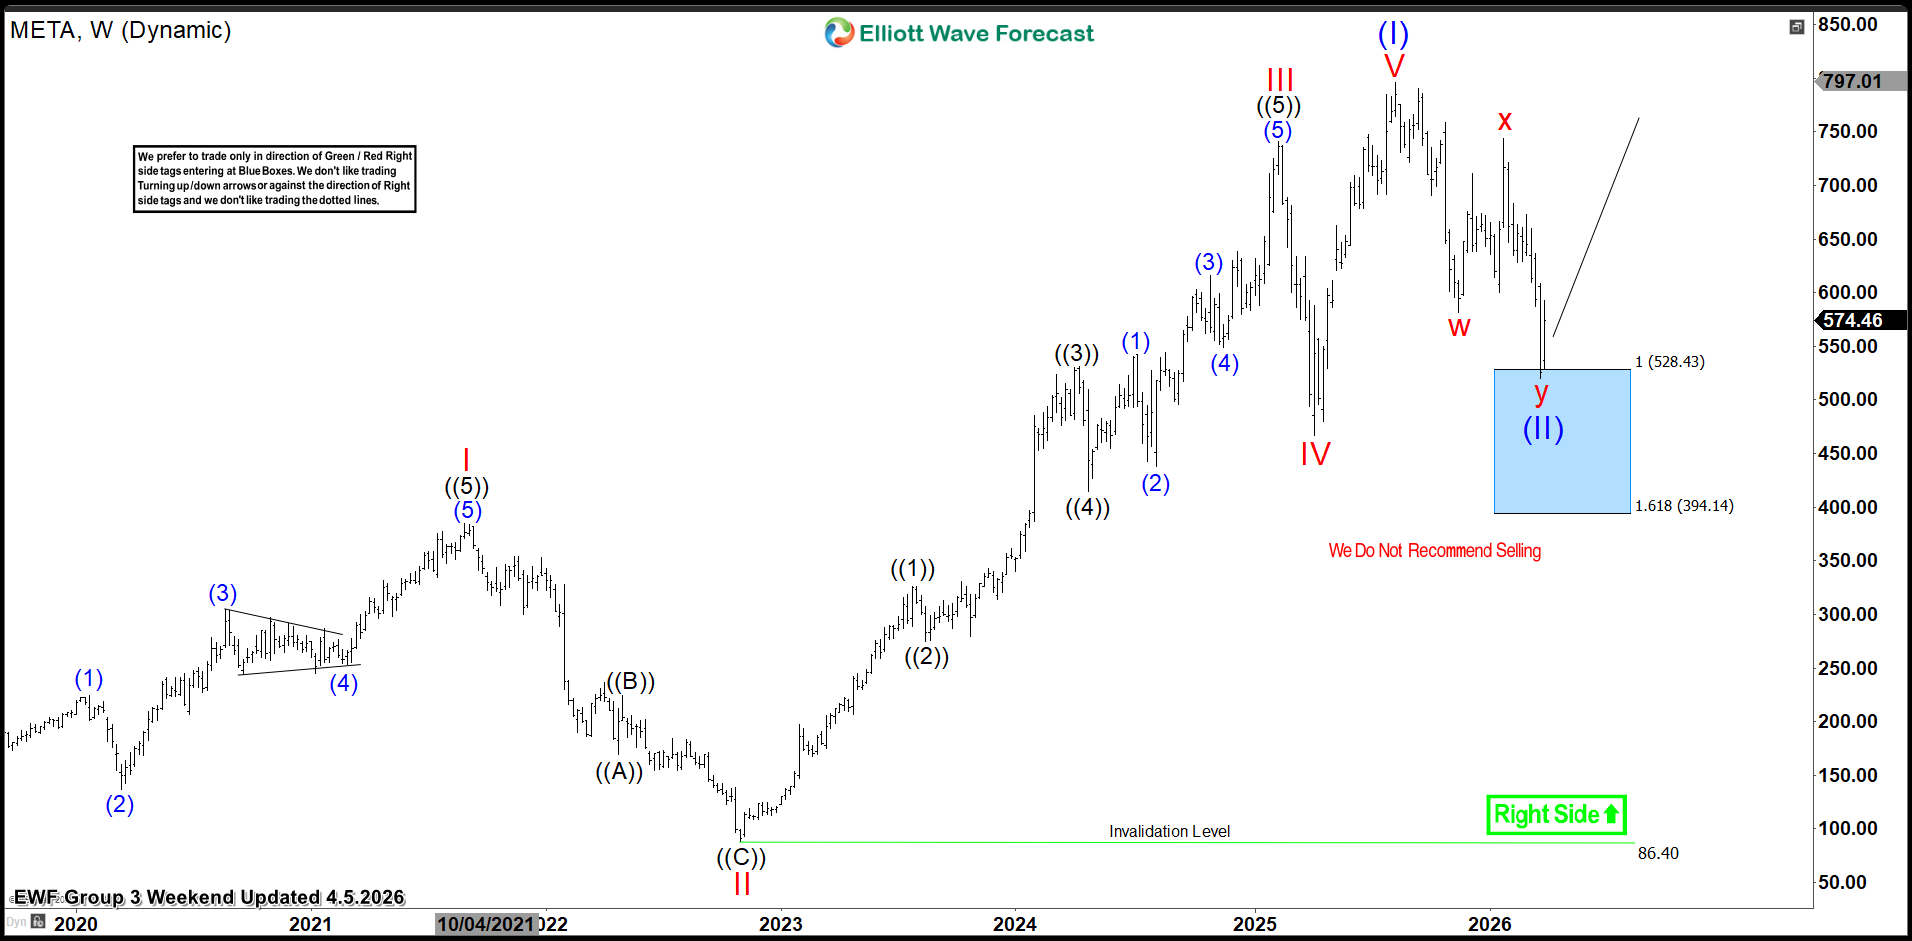
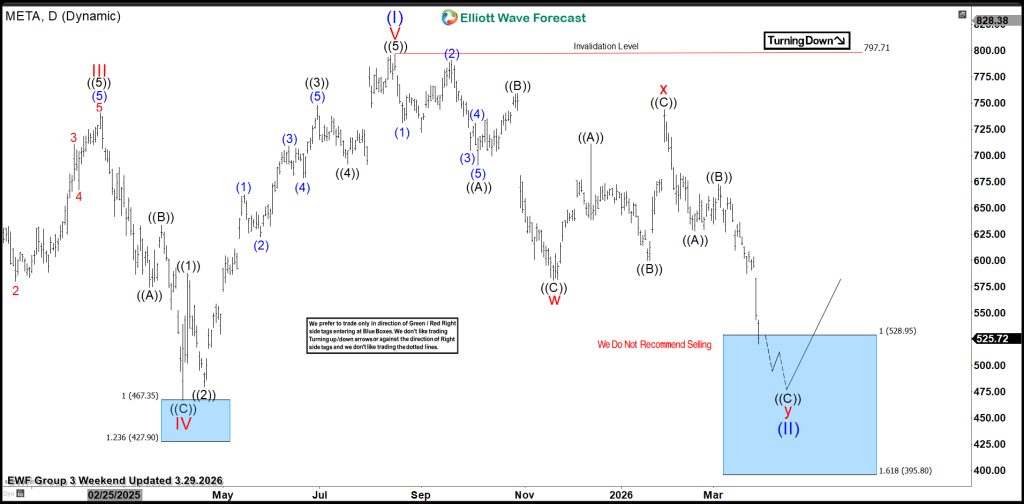
$META Elliott Wave Update: Reaction From Blue Box Areas Has Happened as Expected
In this Elliott Wave update, Meta Platforms Inc. ($META) is being revisited following the previously discussed blue box support areas. As anticipated, the reaction from those areas has happened as expected. Buying interest was seen from the blue box zones, and a meaningful bounce has been produced.
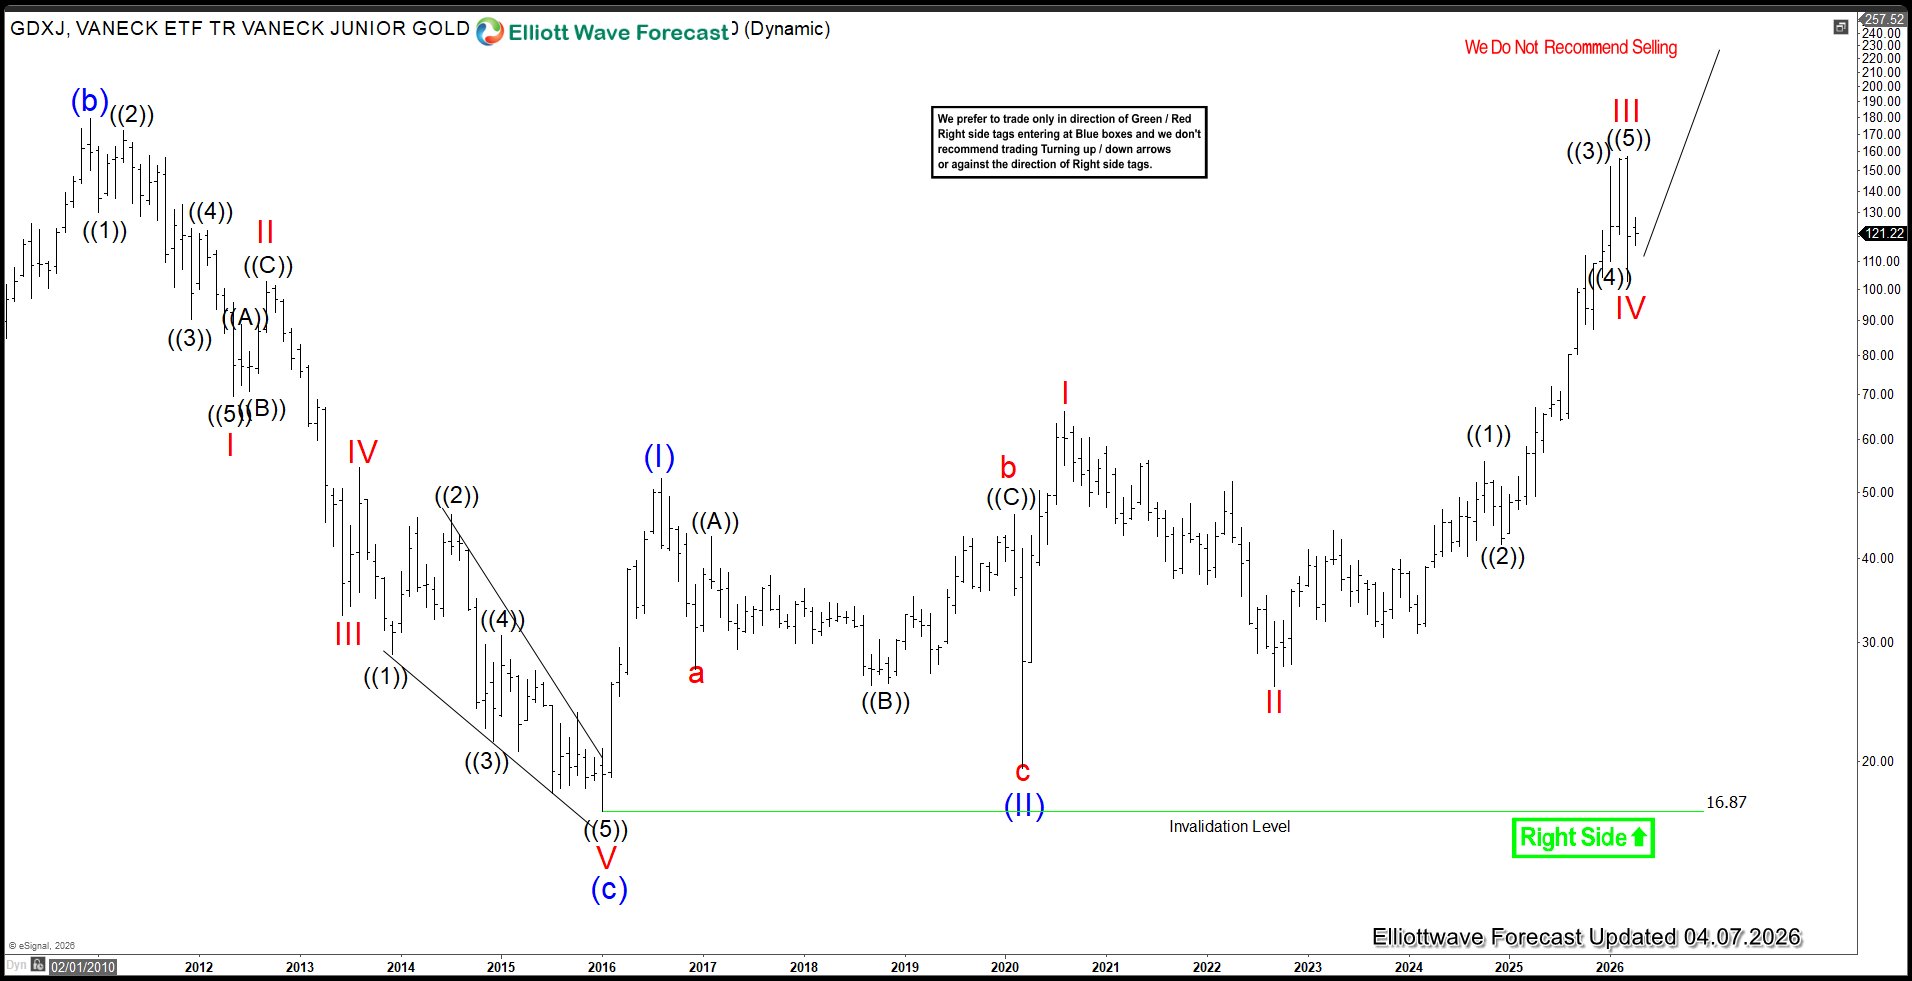
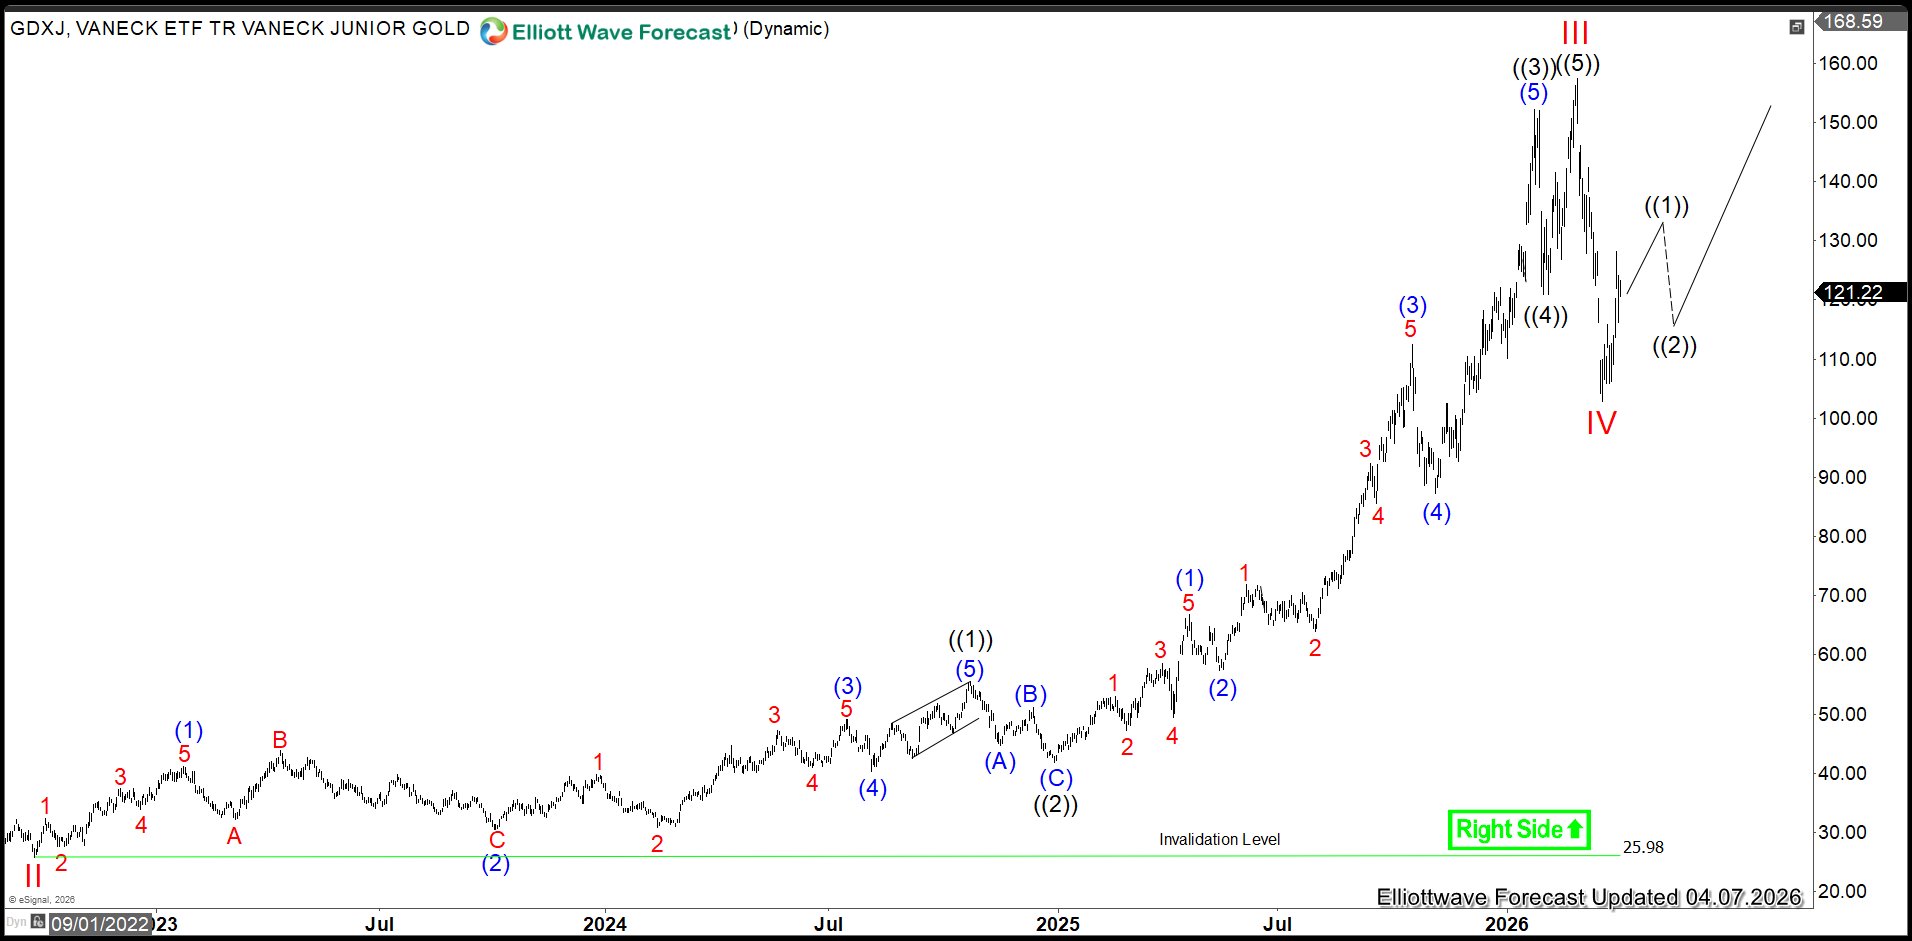
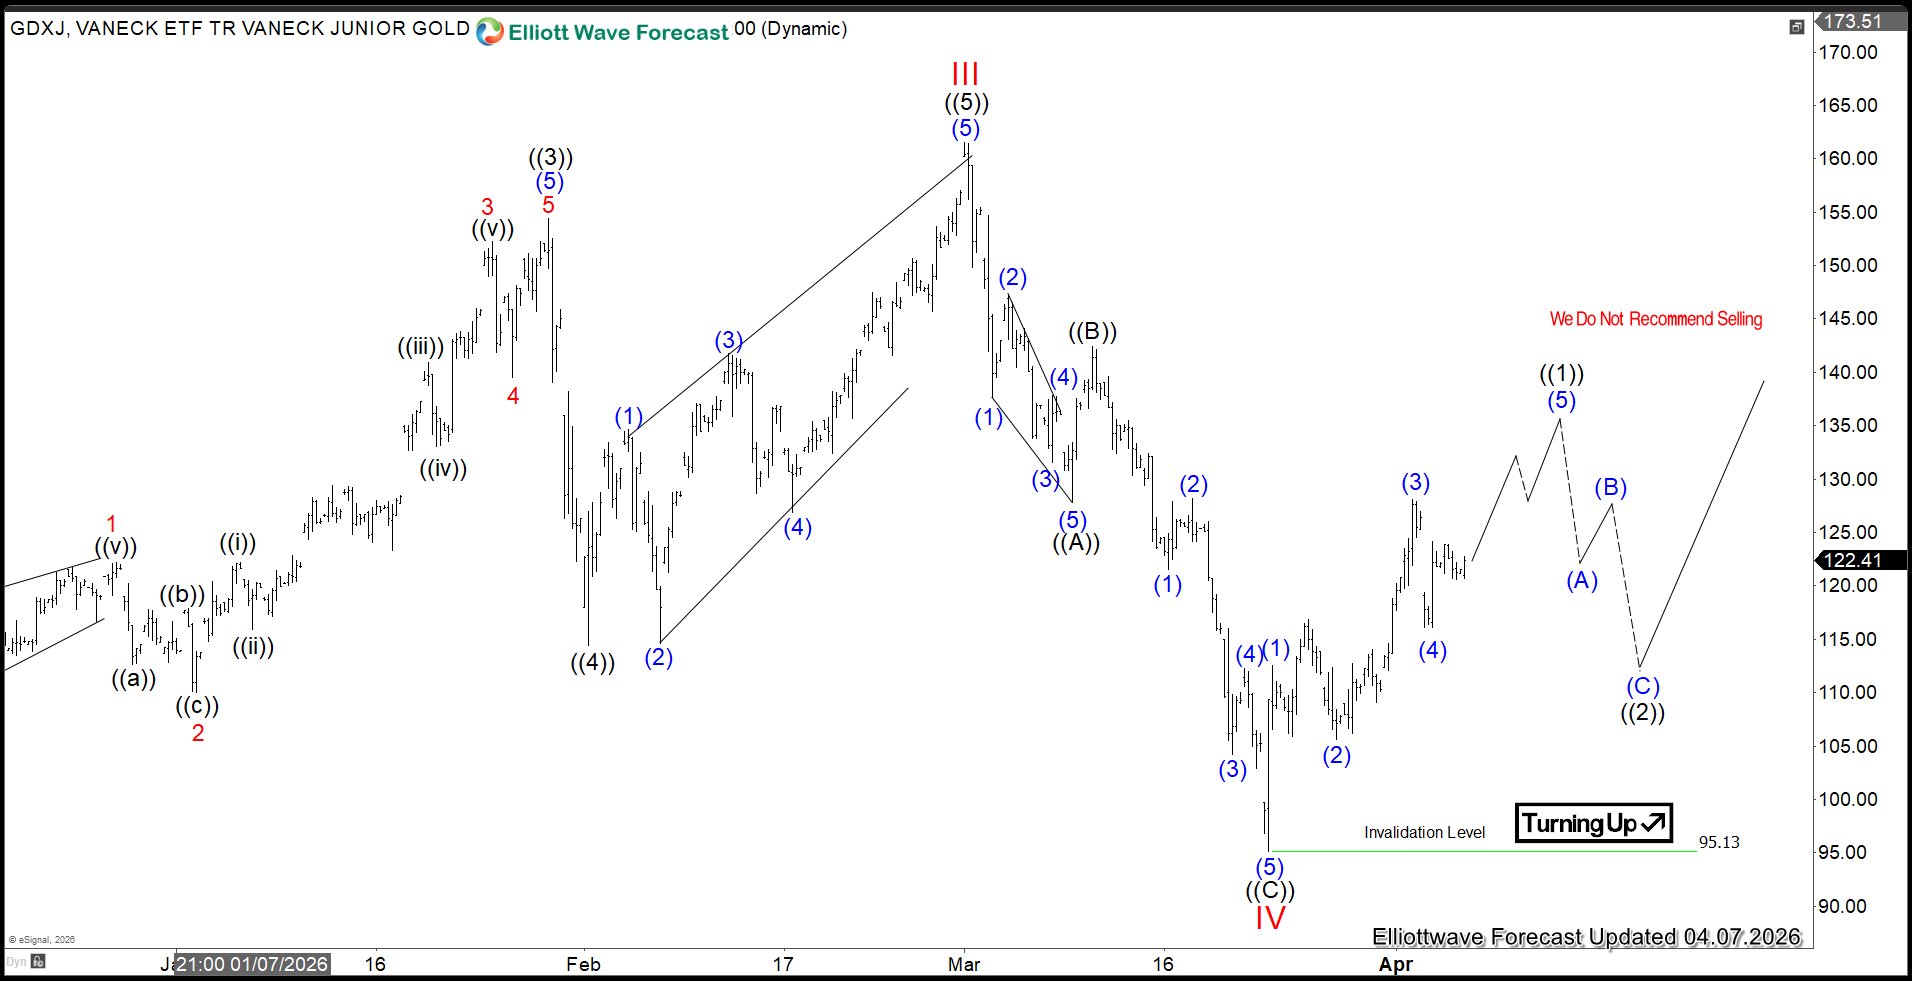
Junior Gold Miners ETF (GDXJ) Breaks Correction, Targets Higher Levels
The VanEck Junior Gold Miners ETF (GDXJ) is a specialty equity fund that tracks the MVIS® Global Junior Gold Miners Index, offering investors exposure to smaller-cap gold mining companies worldwide. It is widely used as a leveraged play on gold prices due to the higher volatility and growth potentia
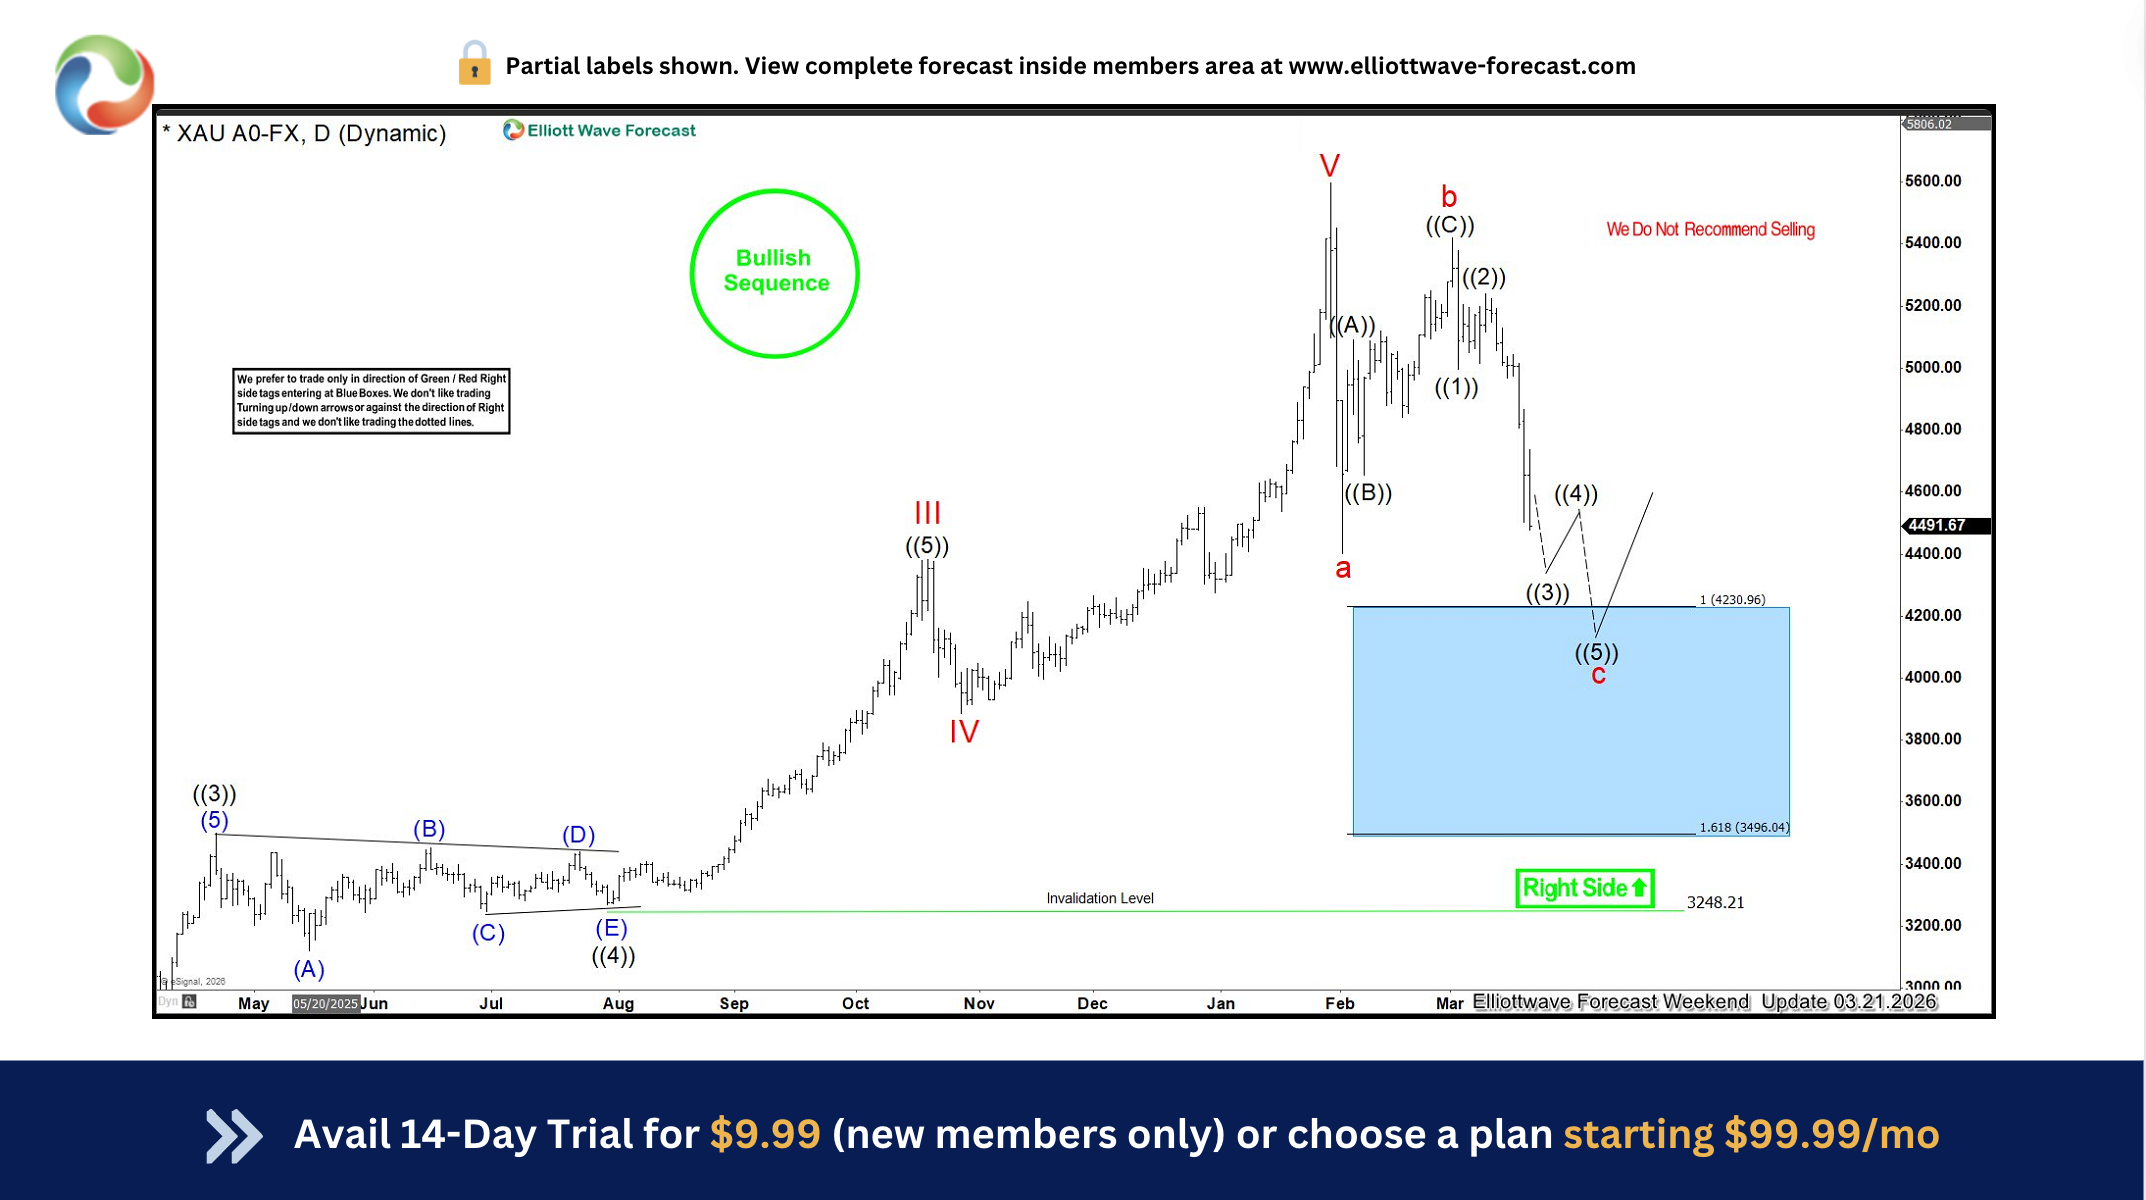
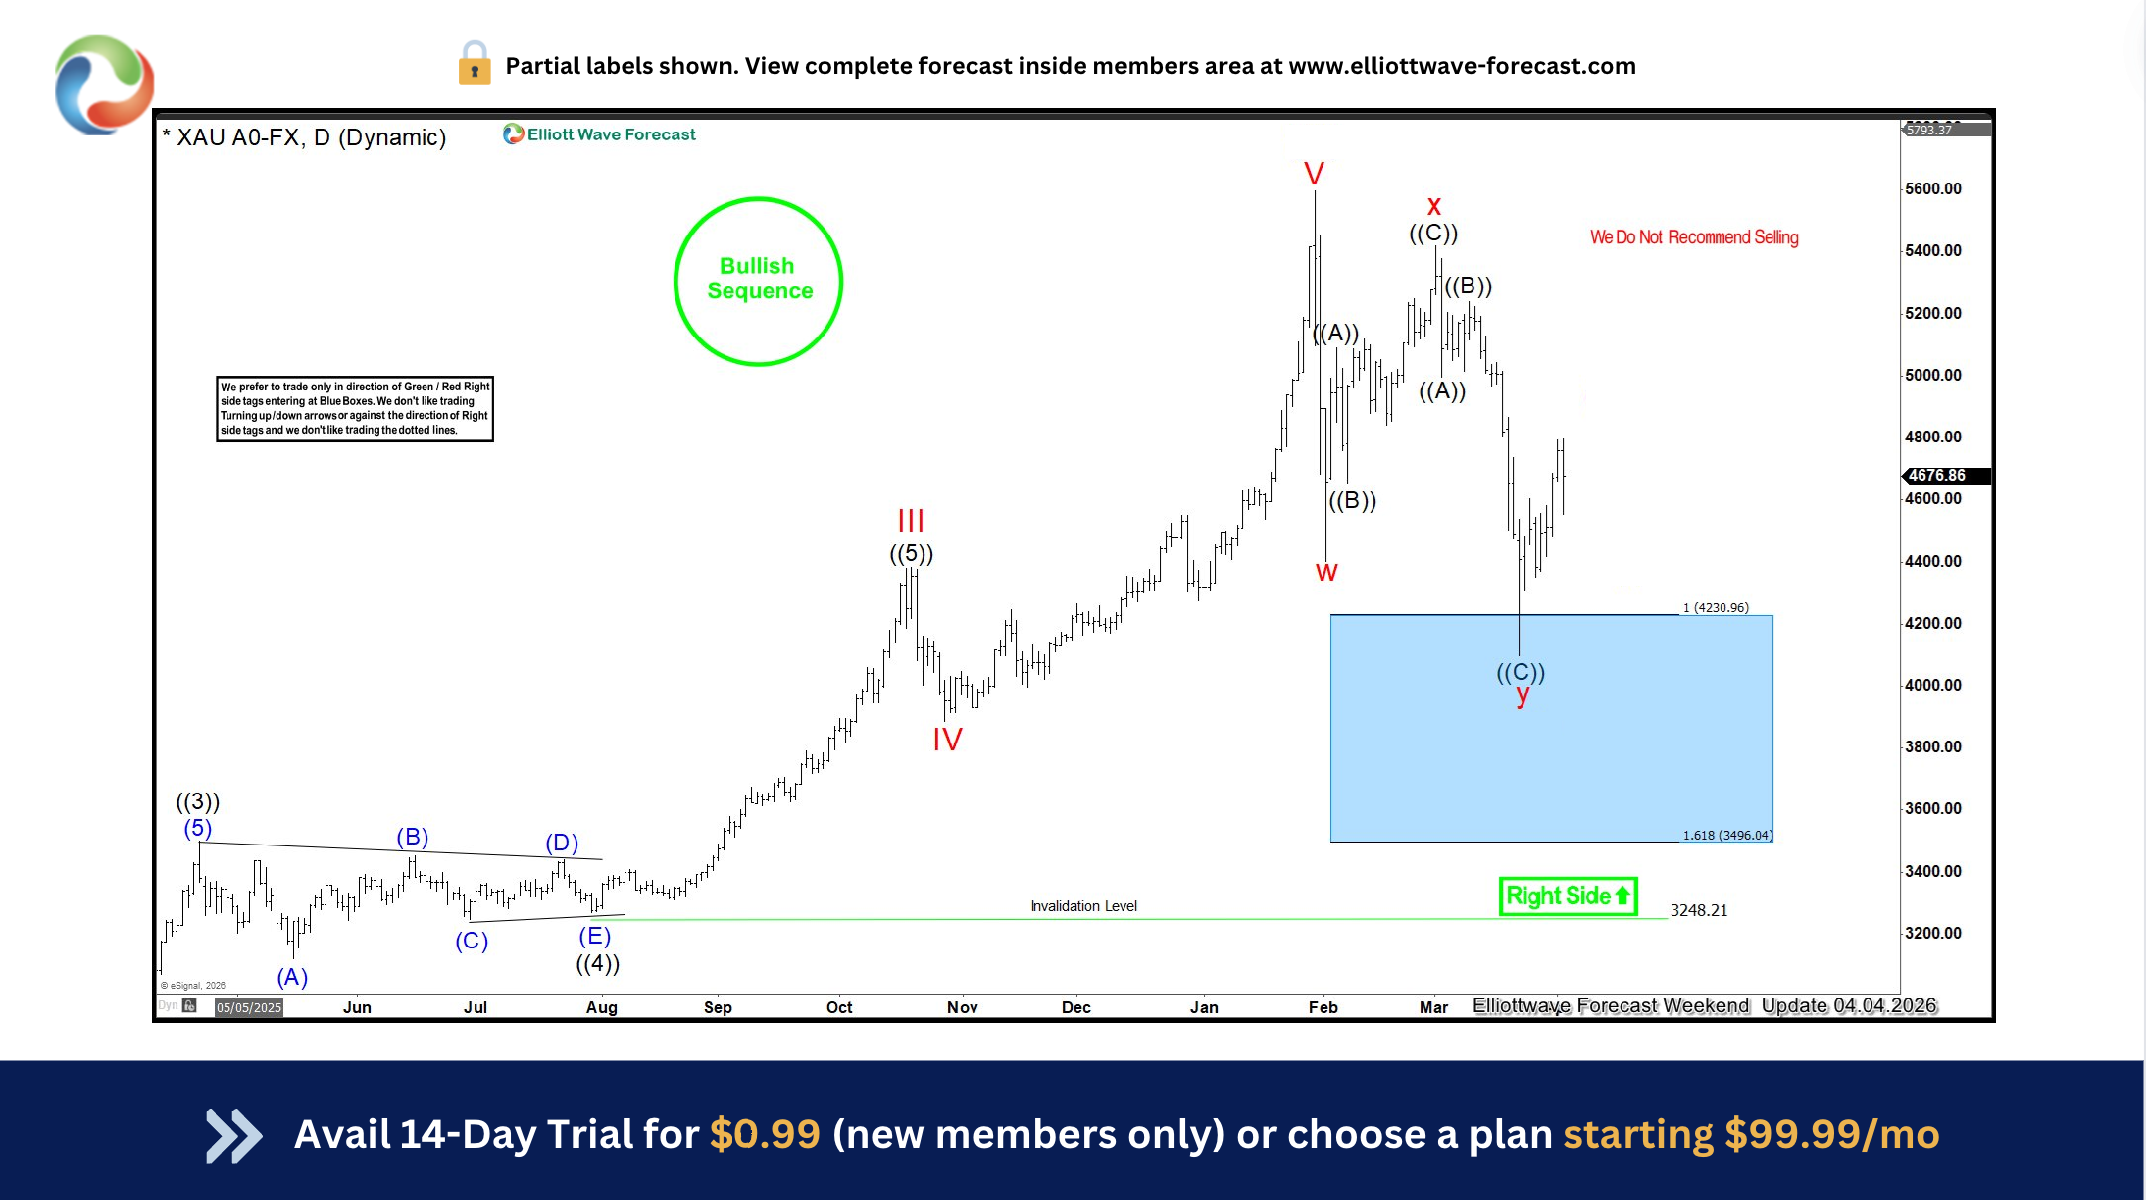
Gold Buyers Step In at Blue Box Zone — Risk-Free Longs Secured
In this technical blog, we will look at the past performance of the Daily Elliott Wave Charts of Gold. In which, the rally from all time low is unfolding as impulse sequence & showed a higher high sequence therefore, called for an extension higher to take place. We knew that the structure in XAU
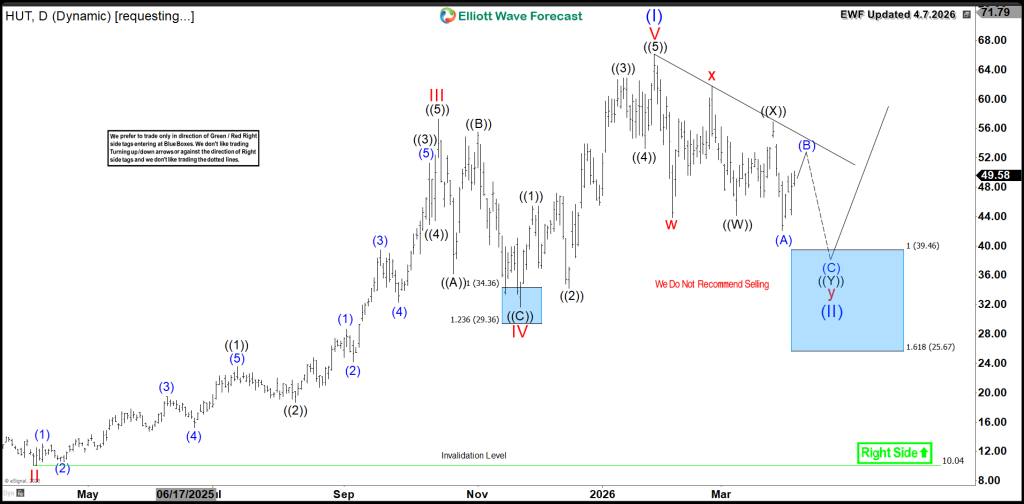
Hut 8 Corp Investment Opportunity Below $50
Hut 8 Corp (NASDAQ: HUT) surged 550% from its April 2025 low. Now, the stock is undergoing a larger degree correction. Today, we inspect its current Elliott Wave structure. Our analysis reveals the next high-probability buying opportunity. Elliott Wave Analysis HUT completed a five-wave advance in w
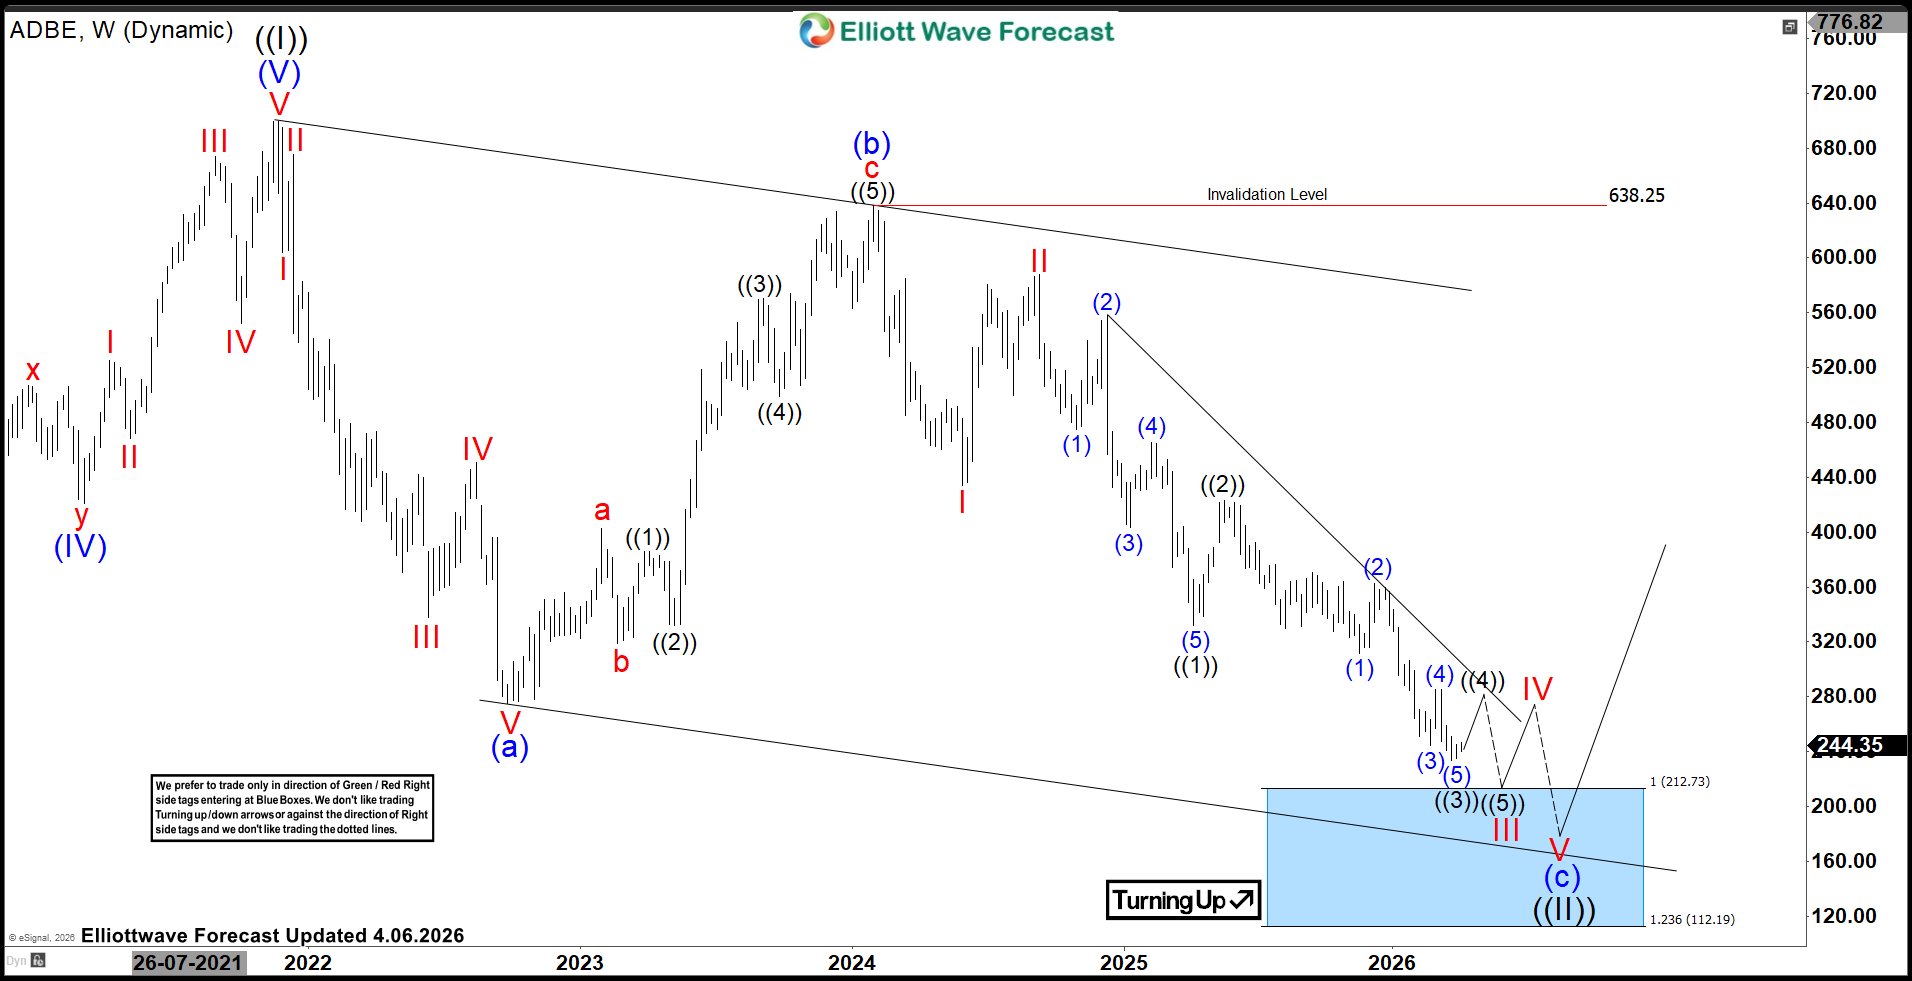
Adobe (ADBE) Elliott Wave Analysis: Deeper Pullback Below 212.7 Before Next Rally
Adobe Inc., (ADBE) operates as a technology company worldwide. The Digital Media segment offer products & services to individuals, teams & enterprises to create, publish & promote content. It comes under Technology sector in Software-Application & trades as “ADBE” ticker at Nasdaq. A
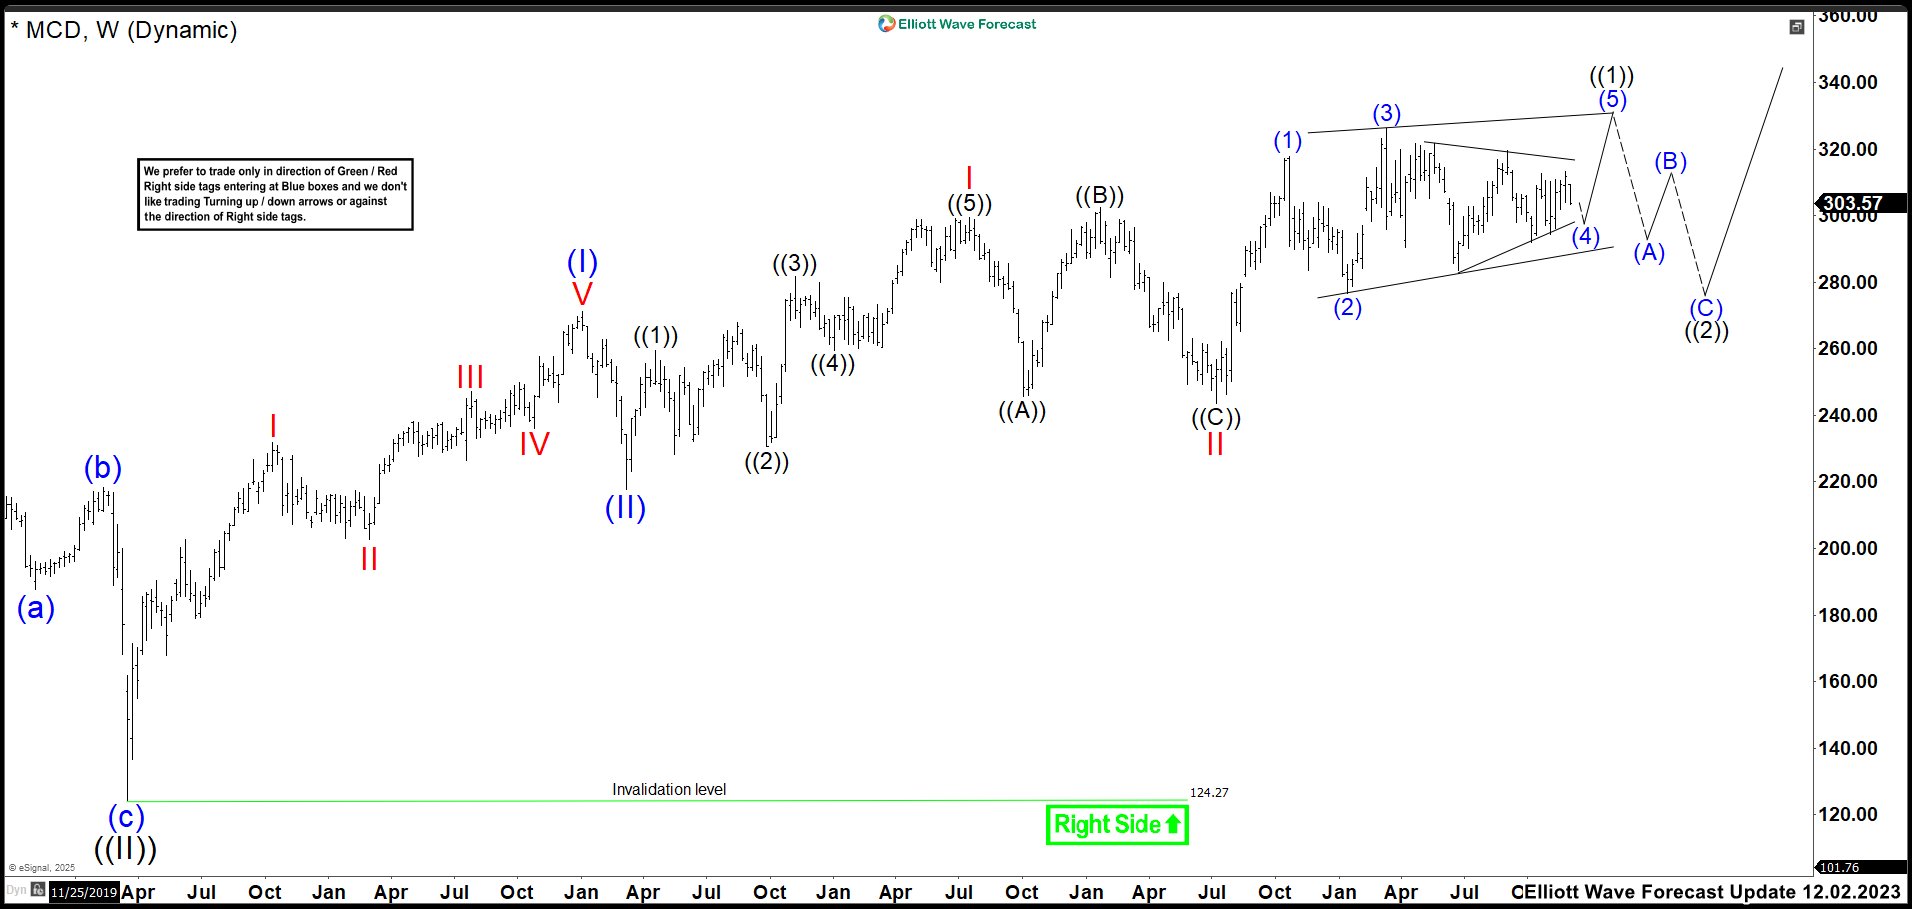
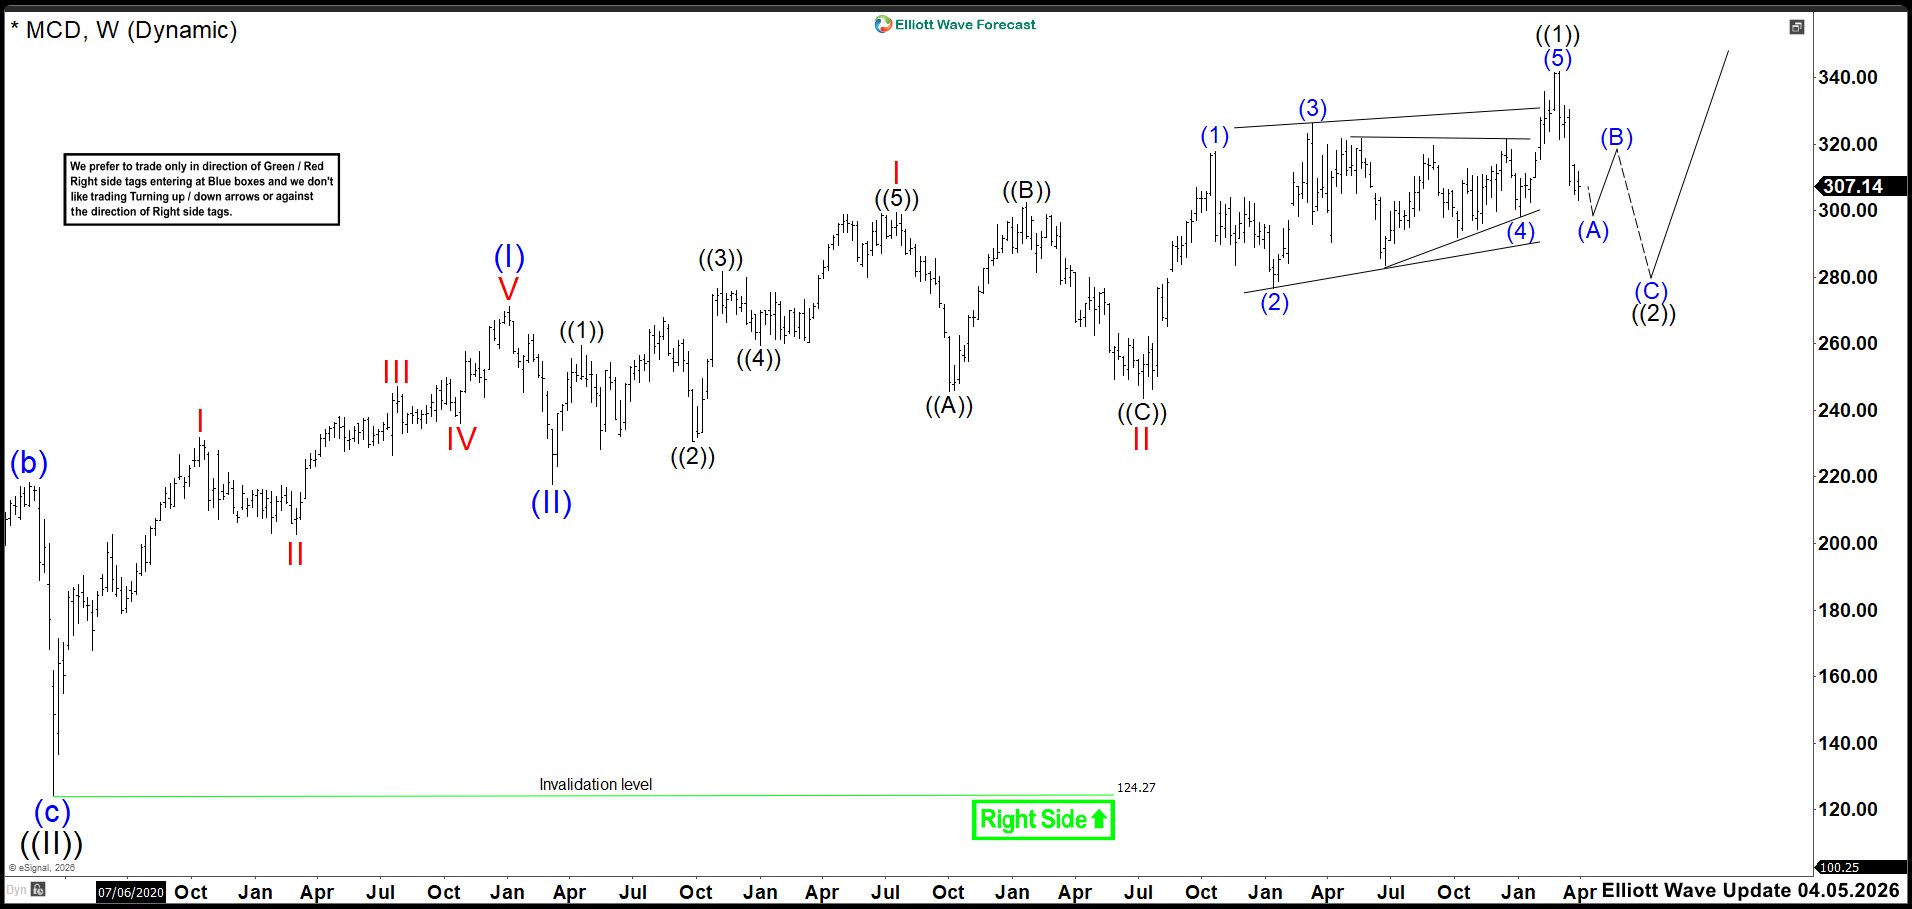
McDonald’s (MCD): Wave ((2)) Correction Outlook
McDonald’s (MCD) enters the second quarter with steady momentum as the stock trades near 307. Moreover, recent performance shows resilient demand despite a slower consumer environment. However, investors still want stronger comparable sales before supporting a sustained breakout. Therefore, the

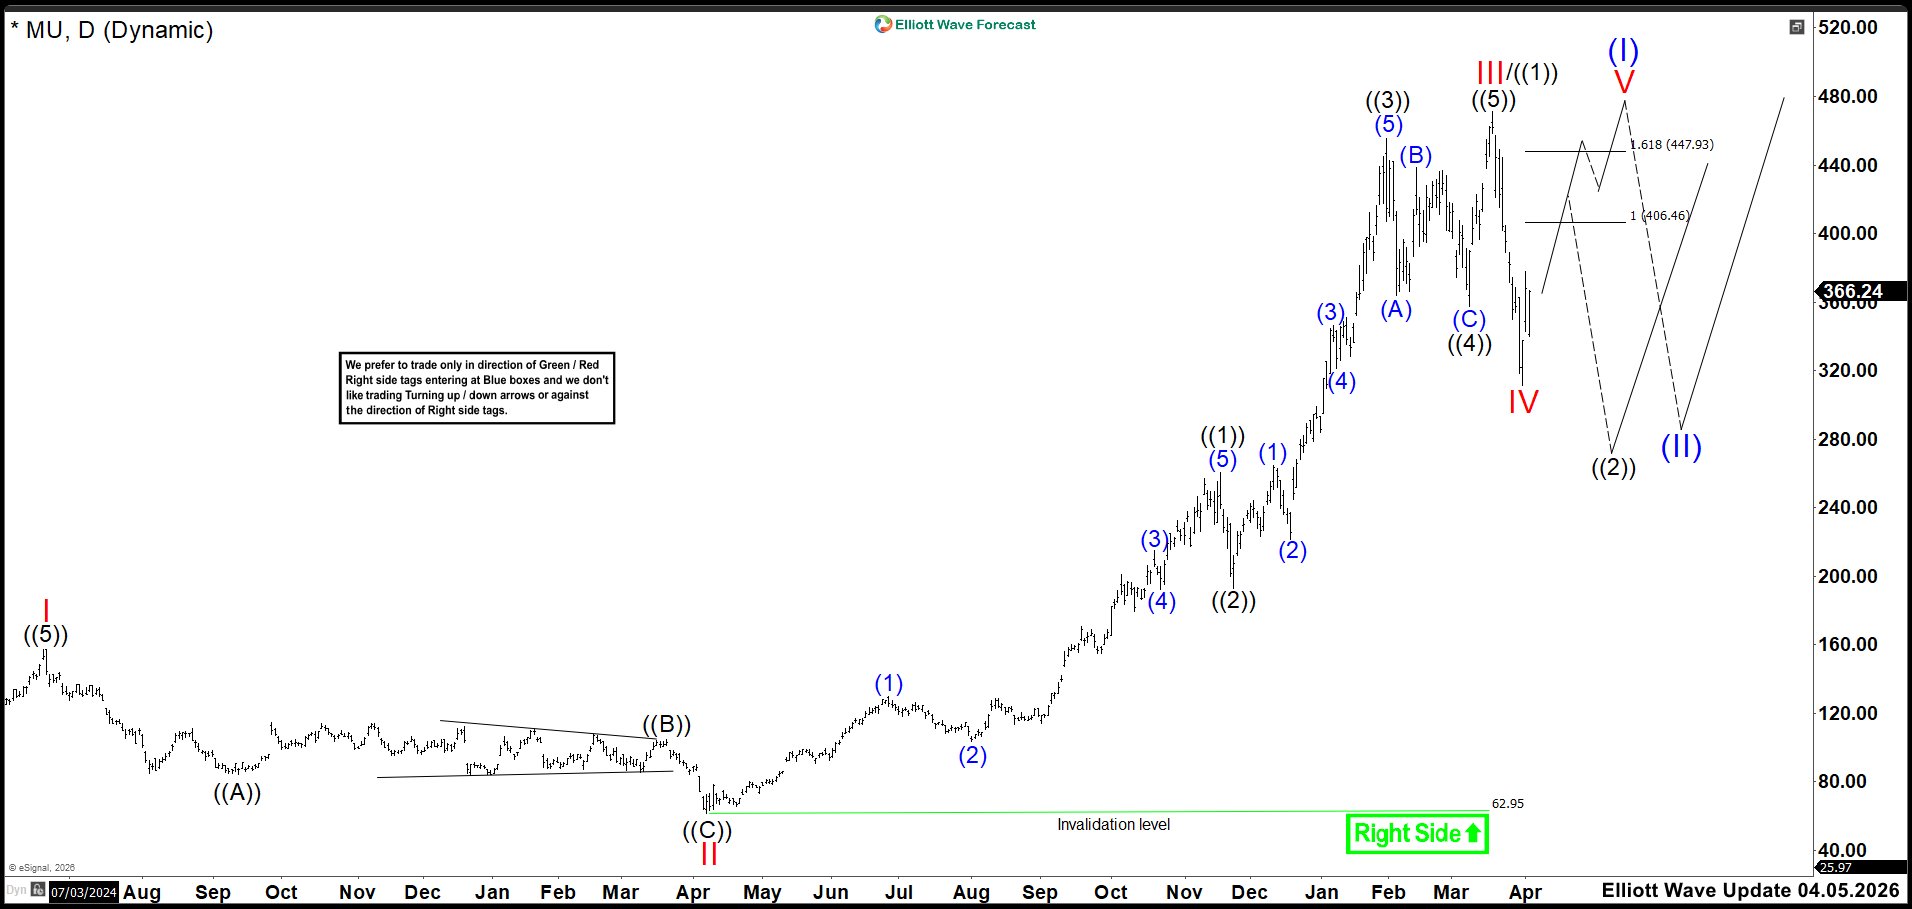
MU Elliott Wave Update: Two Bullish Scenarios Targeting 406-447 Zone
Micron (MU) delivered a strong second quarter because AI memory demand expanded rapidly. Moreover, revenue exceeded expectations, which boosted institutional confidence. However, the market reacted cautiously since memory pricing remains highly cyclical. Therefore, analysts expect continued volatili
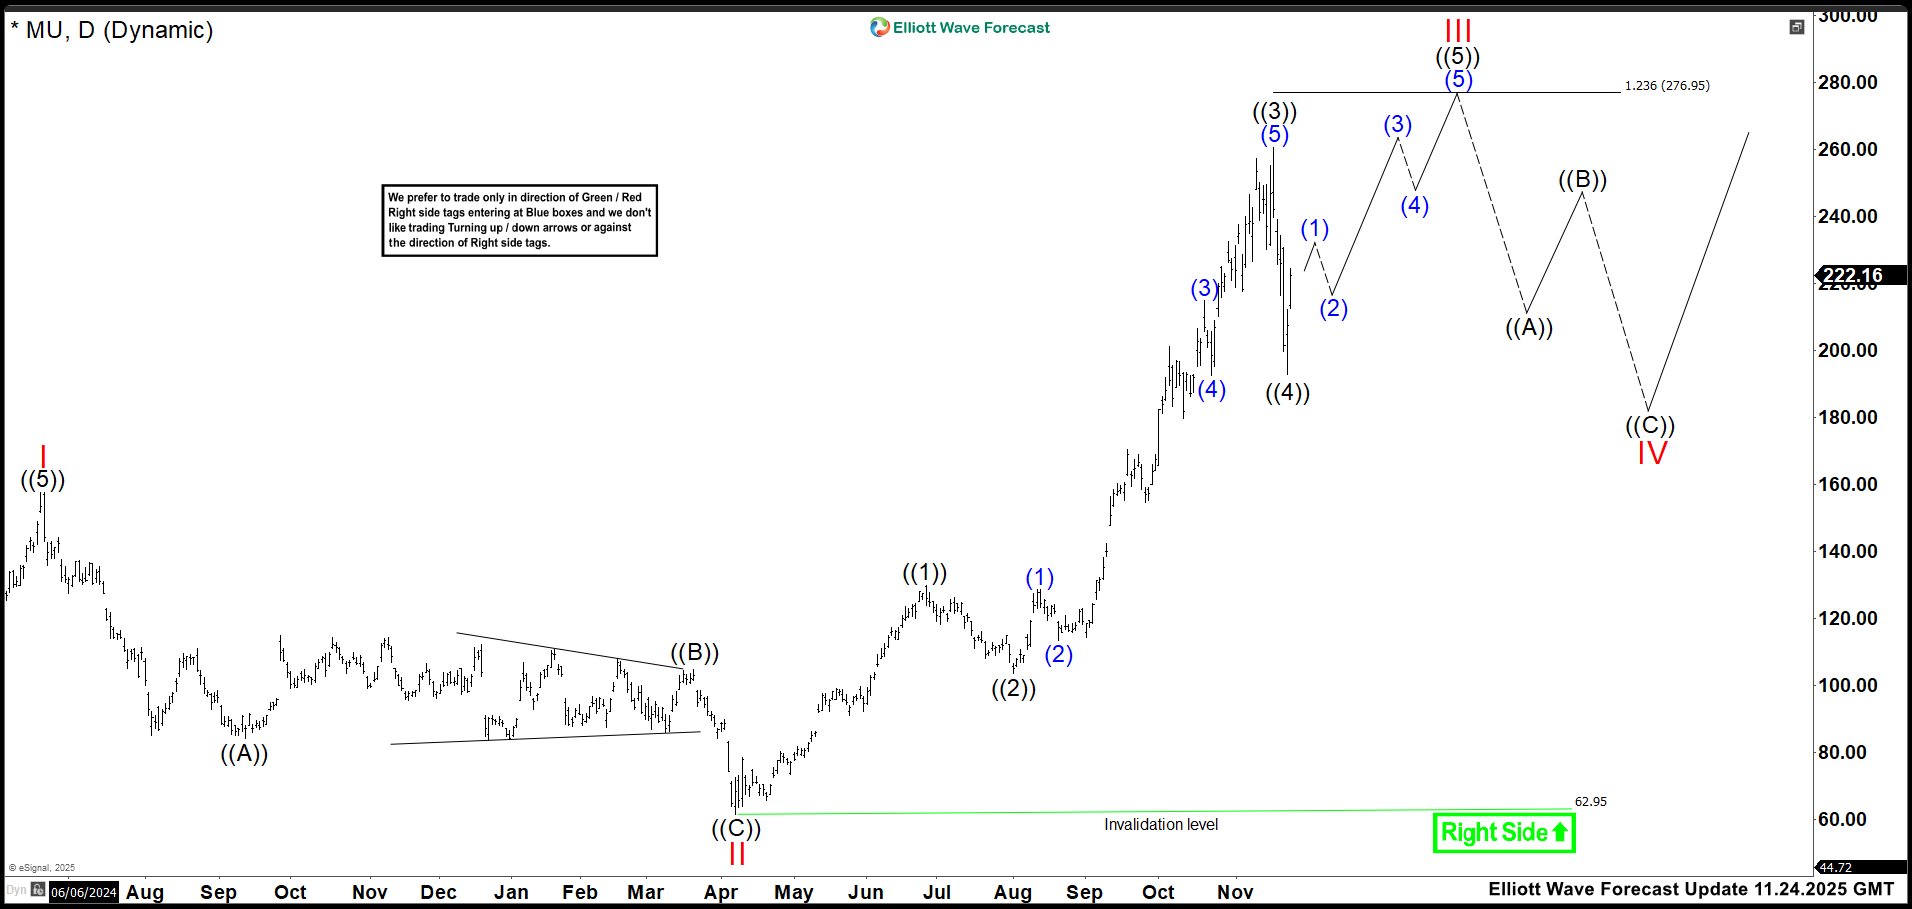


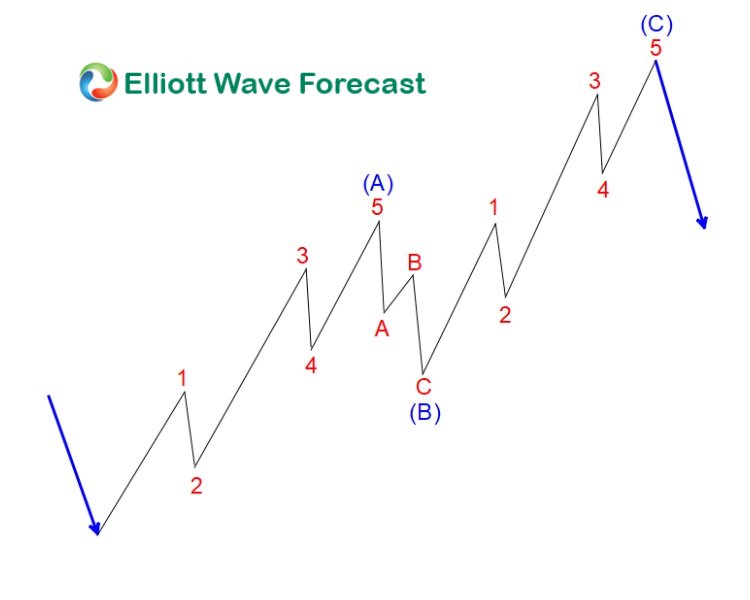
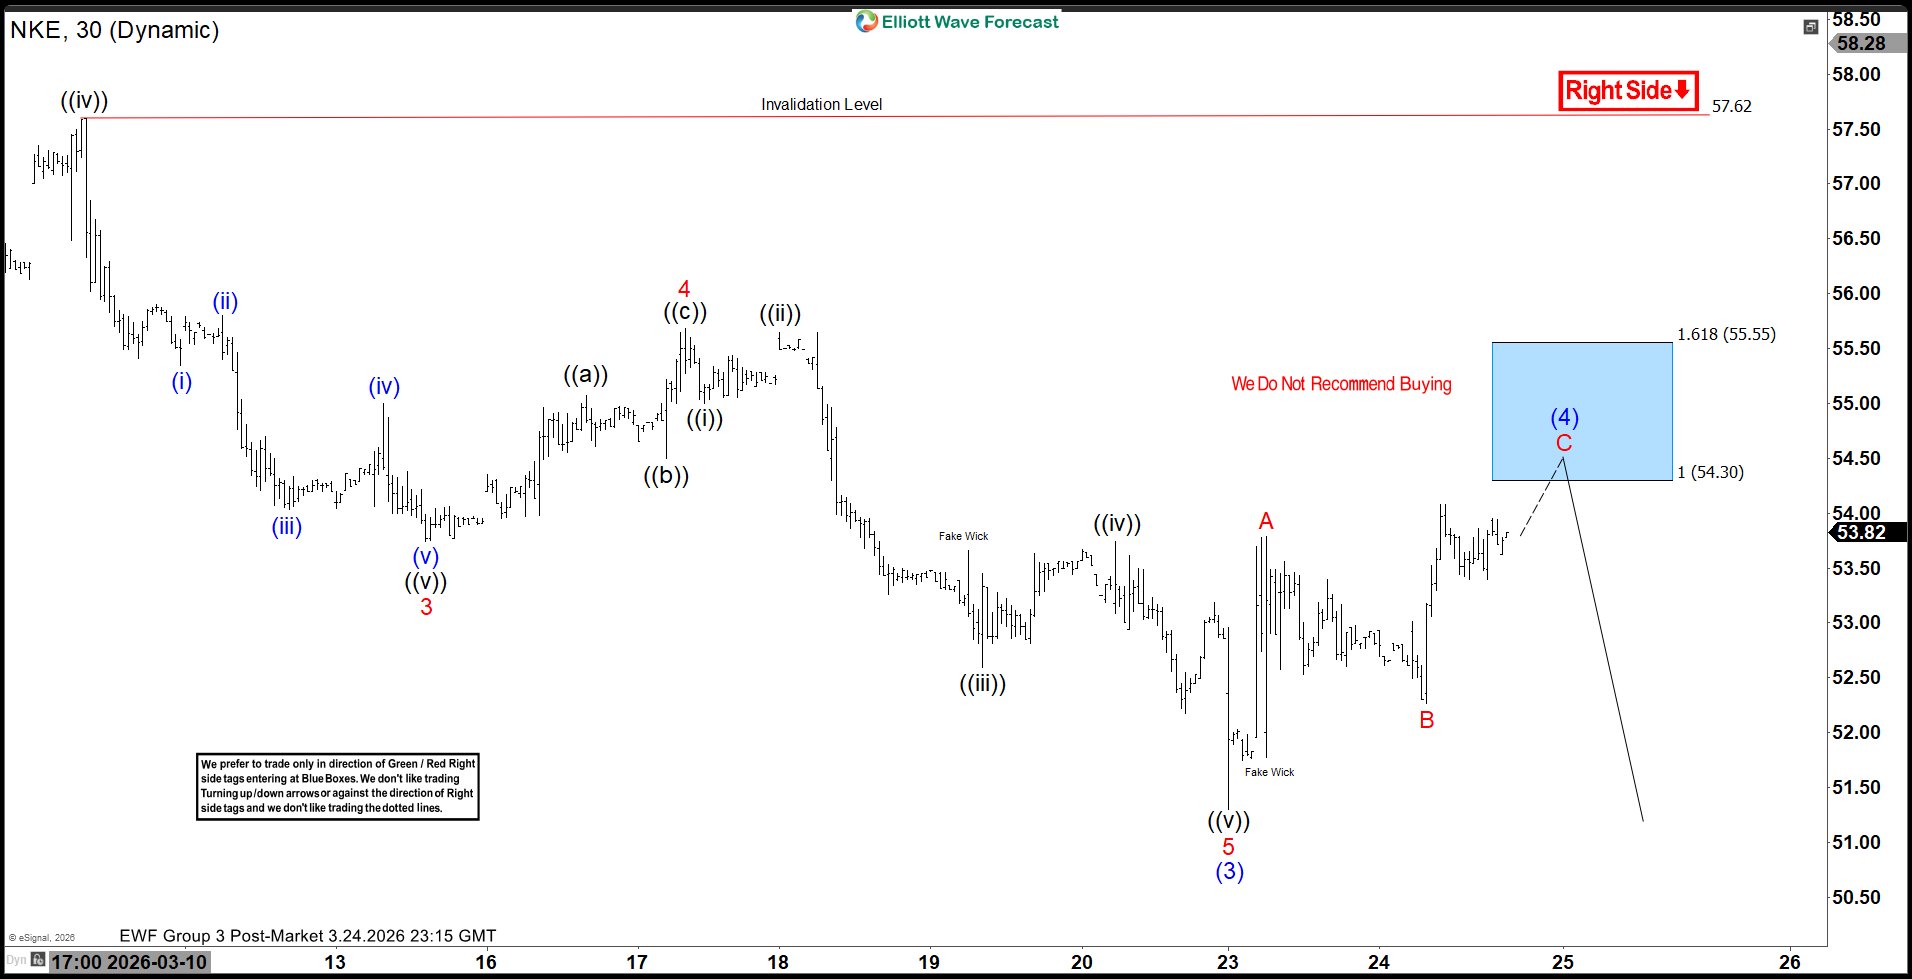
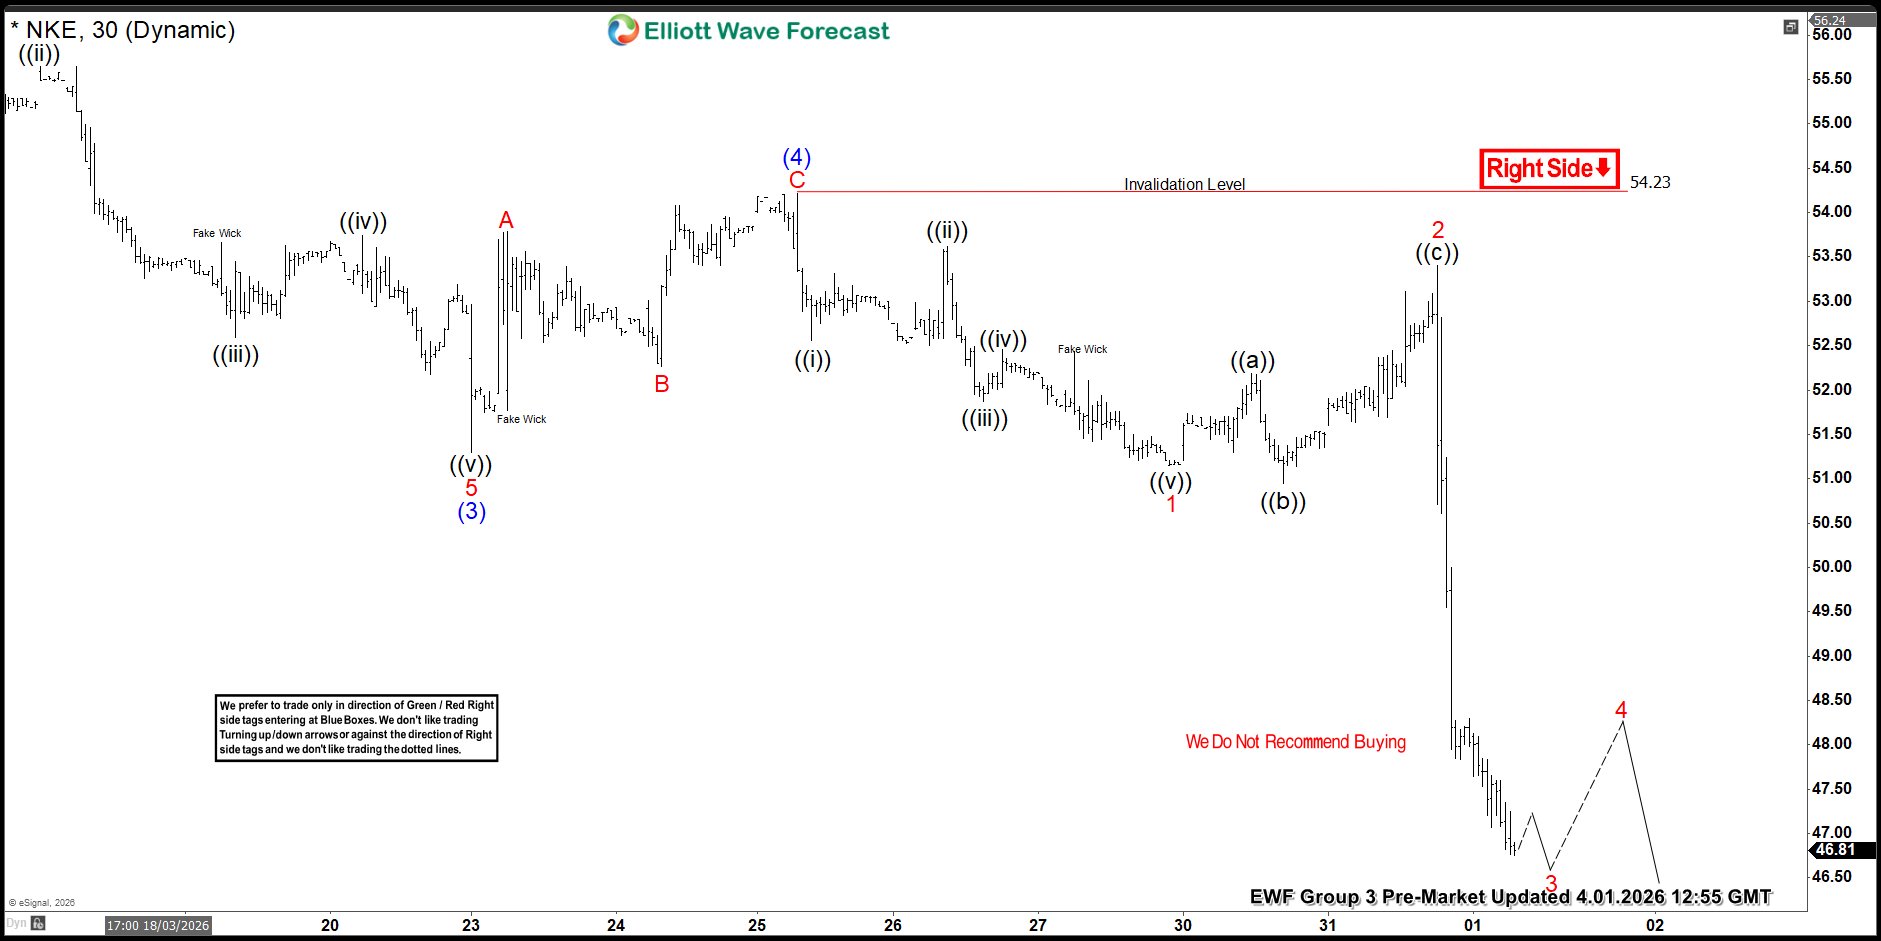
Nike Inc. $NKE Blue Box Area Offering a Selling Opportunity
In this Elliott Wave update, the latest structure in Nike Inc. ($NKE) is being reviewed. A larger bearish sequence continues to be seen, and the stock remains under pressure within a grand super cycle correction. ABC correction$NKE 1H Elliott Wave Chart 3.24.2026: On the current chart, a decline app
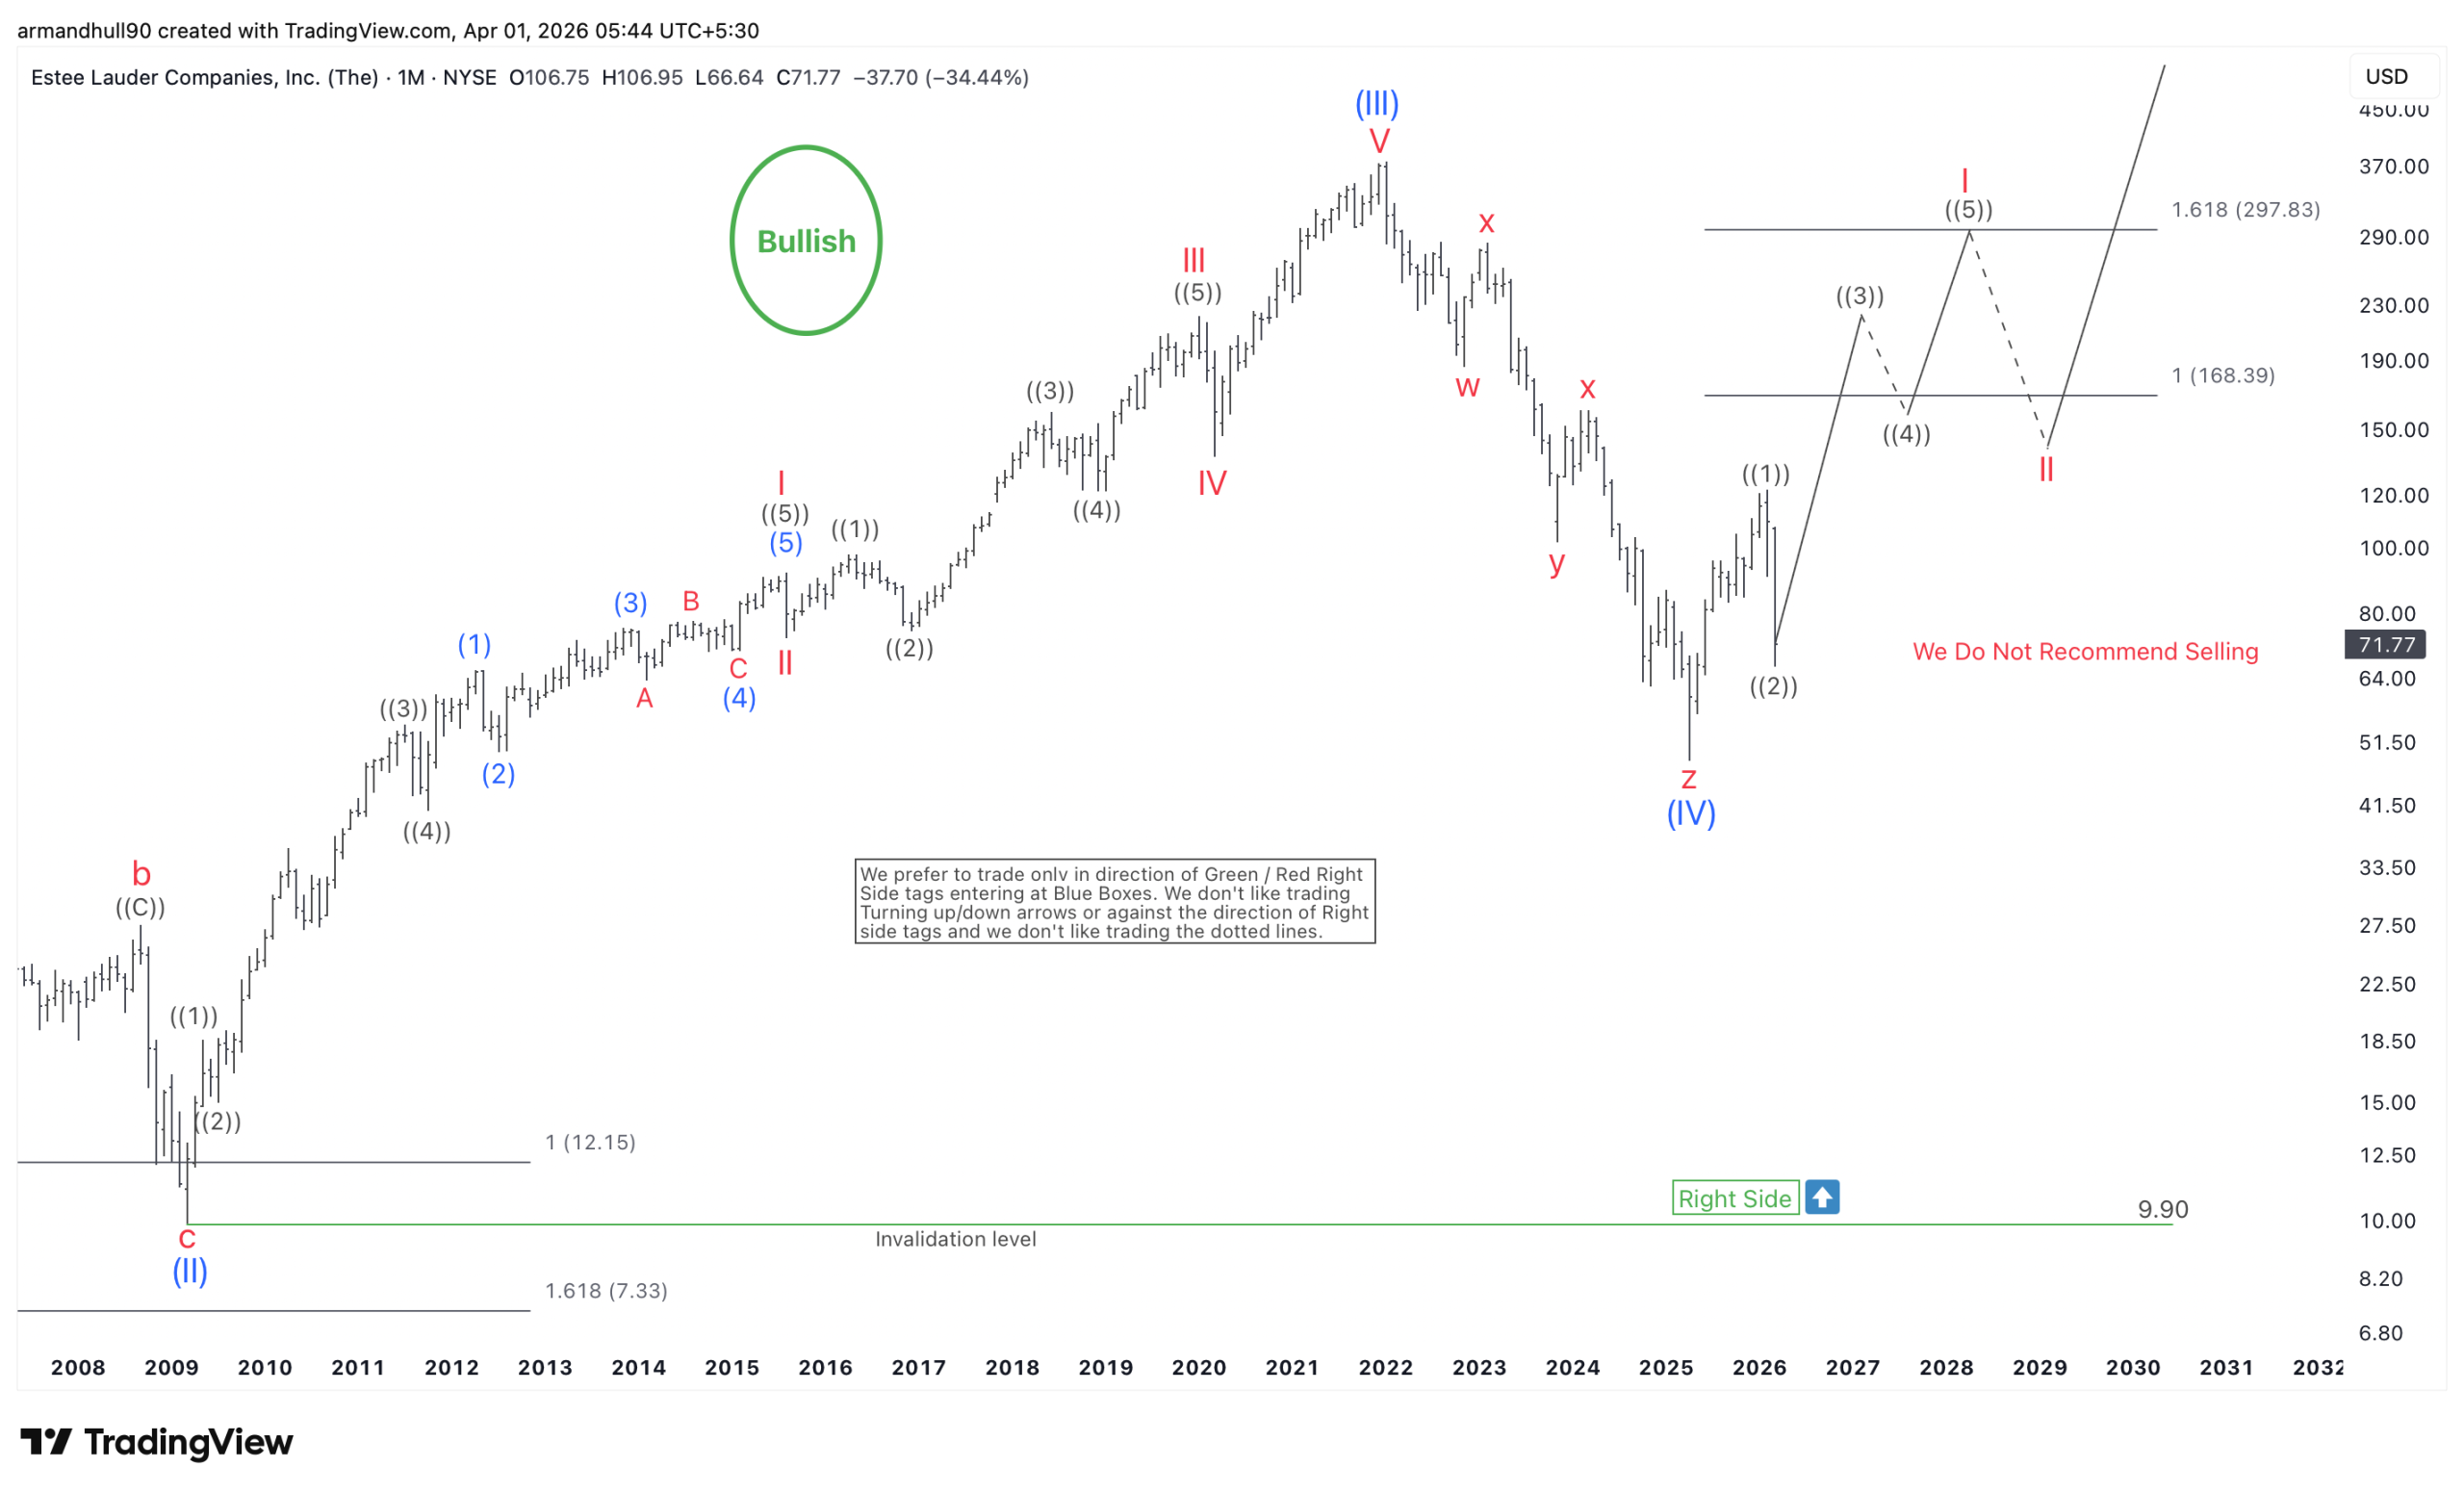
Estée Lauder (EL) Wave V Recovery Signals Strong Upside Ahead
Estée Lauder (EL) has completed a major bullish cycle within wave (III), which topped near 374.20. The structure within this advance shows a clear five-wave sequence, with wave I extending strongly and driving the broader trend higher. This type of extension often reflects strong momentum and instit
The Expected Market Pullback Most Traders Will Miss Again
Markets rarely reward consensus in the way most participants expect. Right now, a large portion of traders are anticipating a pullback. But anticipation alone does not translate into execution. In reality, most participants will enter too early, hesitate when the opportunity appears, or miss the mov
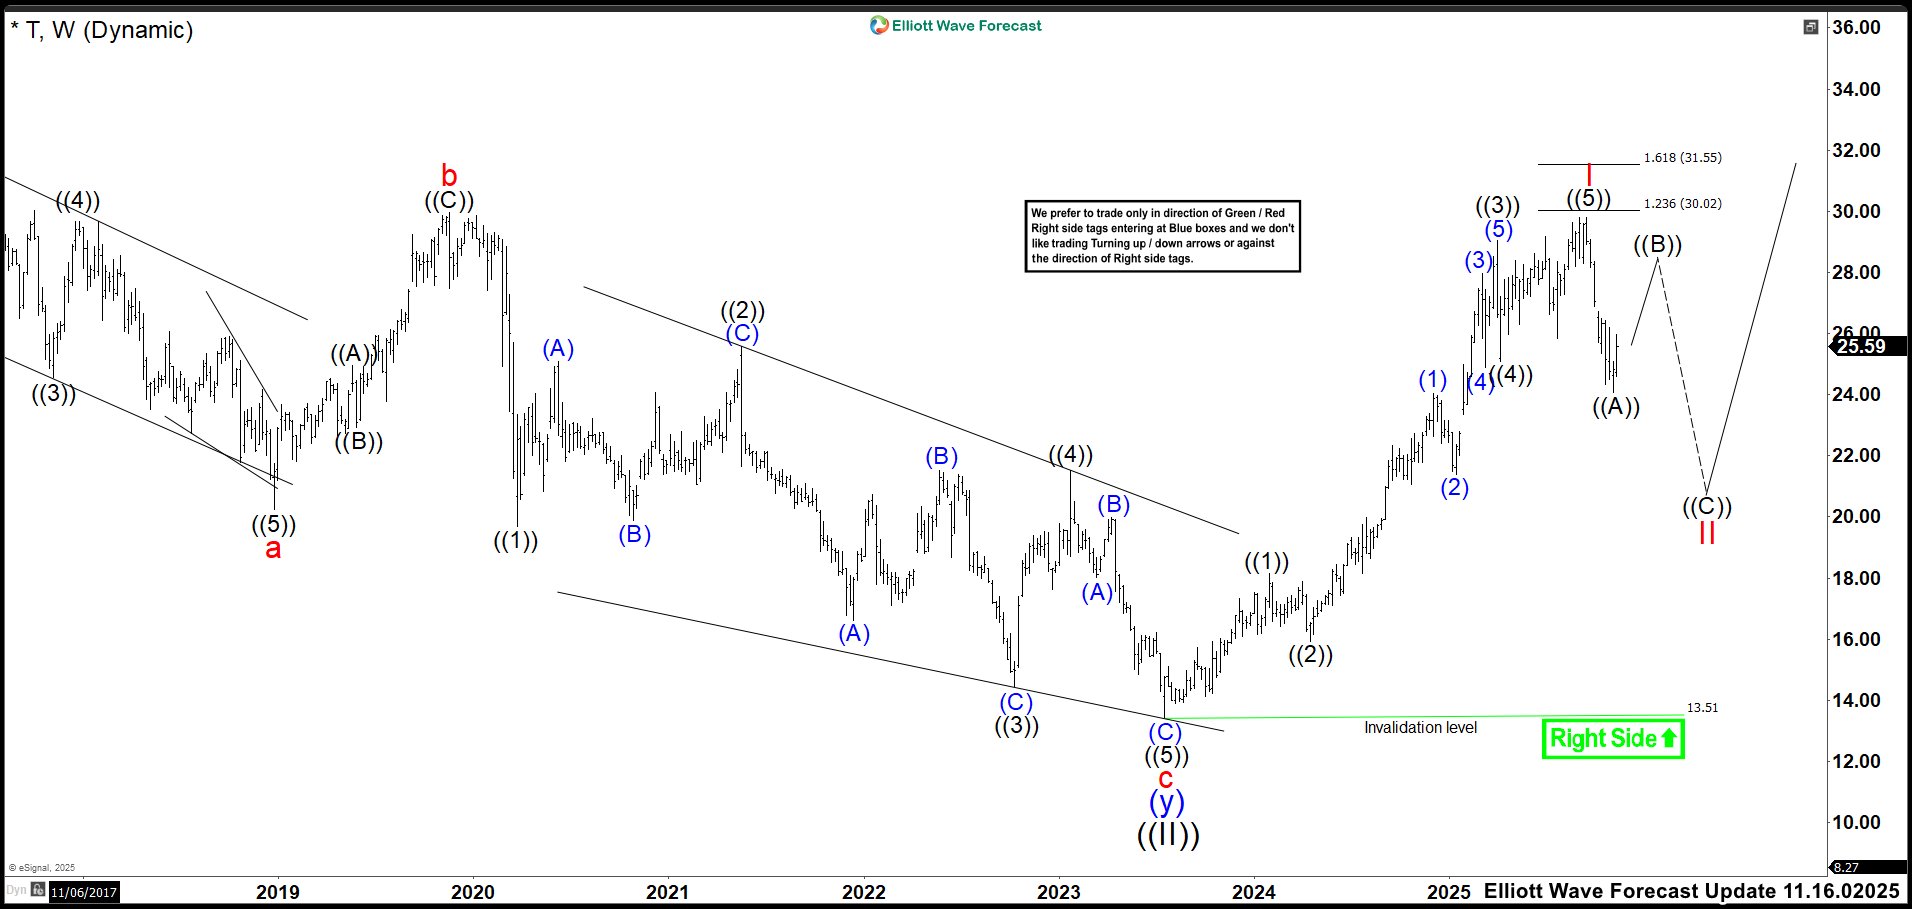
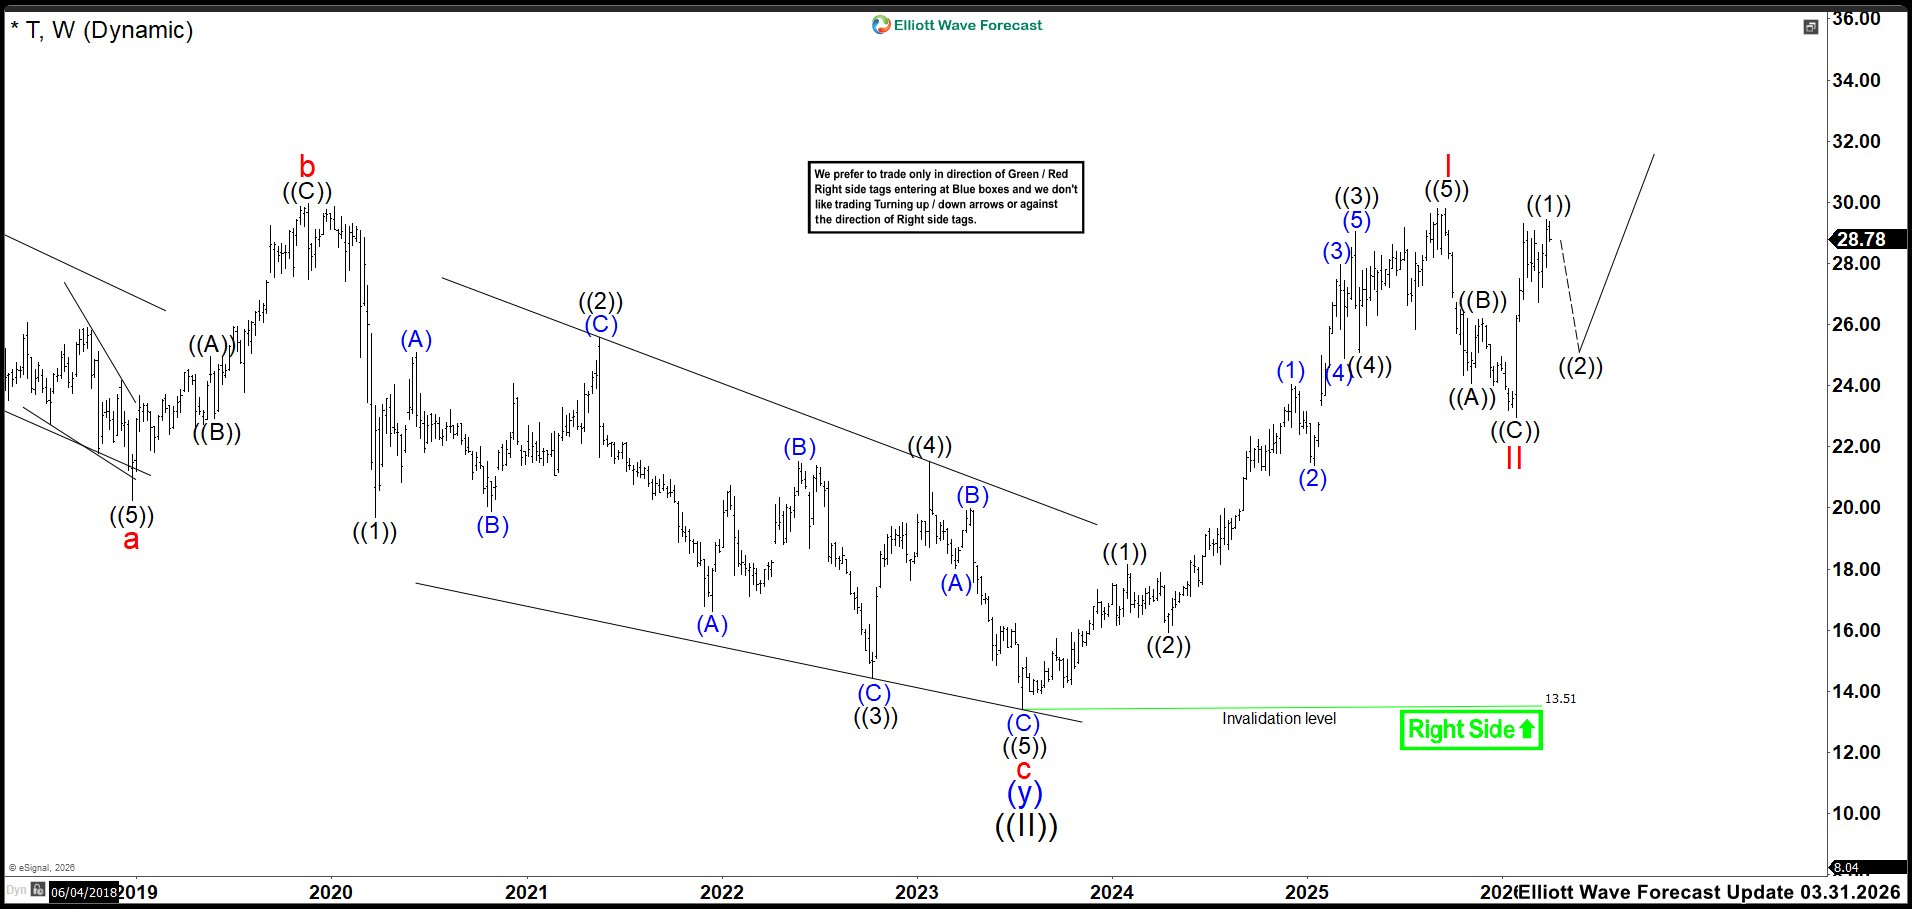
AT&T (T): Key Support Holds as Market Prepares for Next Rally
Analysts expect AT&T (T) to deliver stable performance in the second quarter of 2026. First, the company continues to show solid execution in wireless and fiber growth. Moreover, recent earnings have consistently beaten expectations, which strengthens investor confidence. In addition, Wall Stree

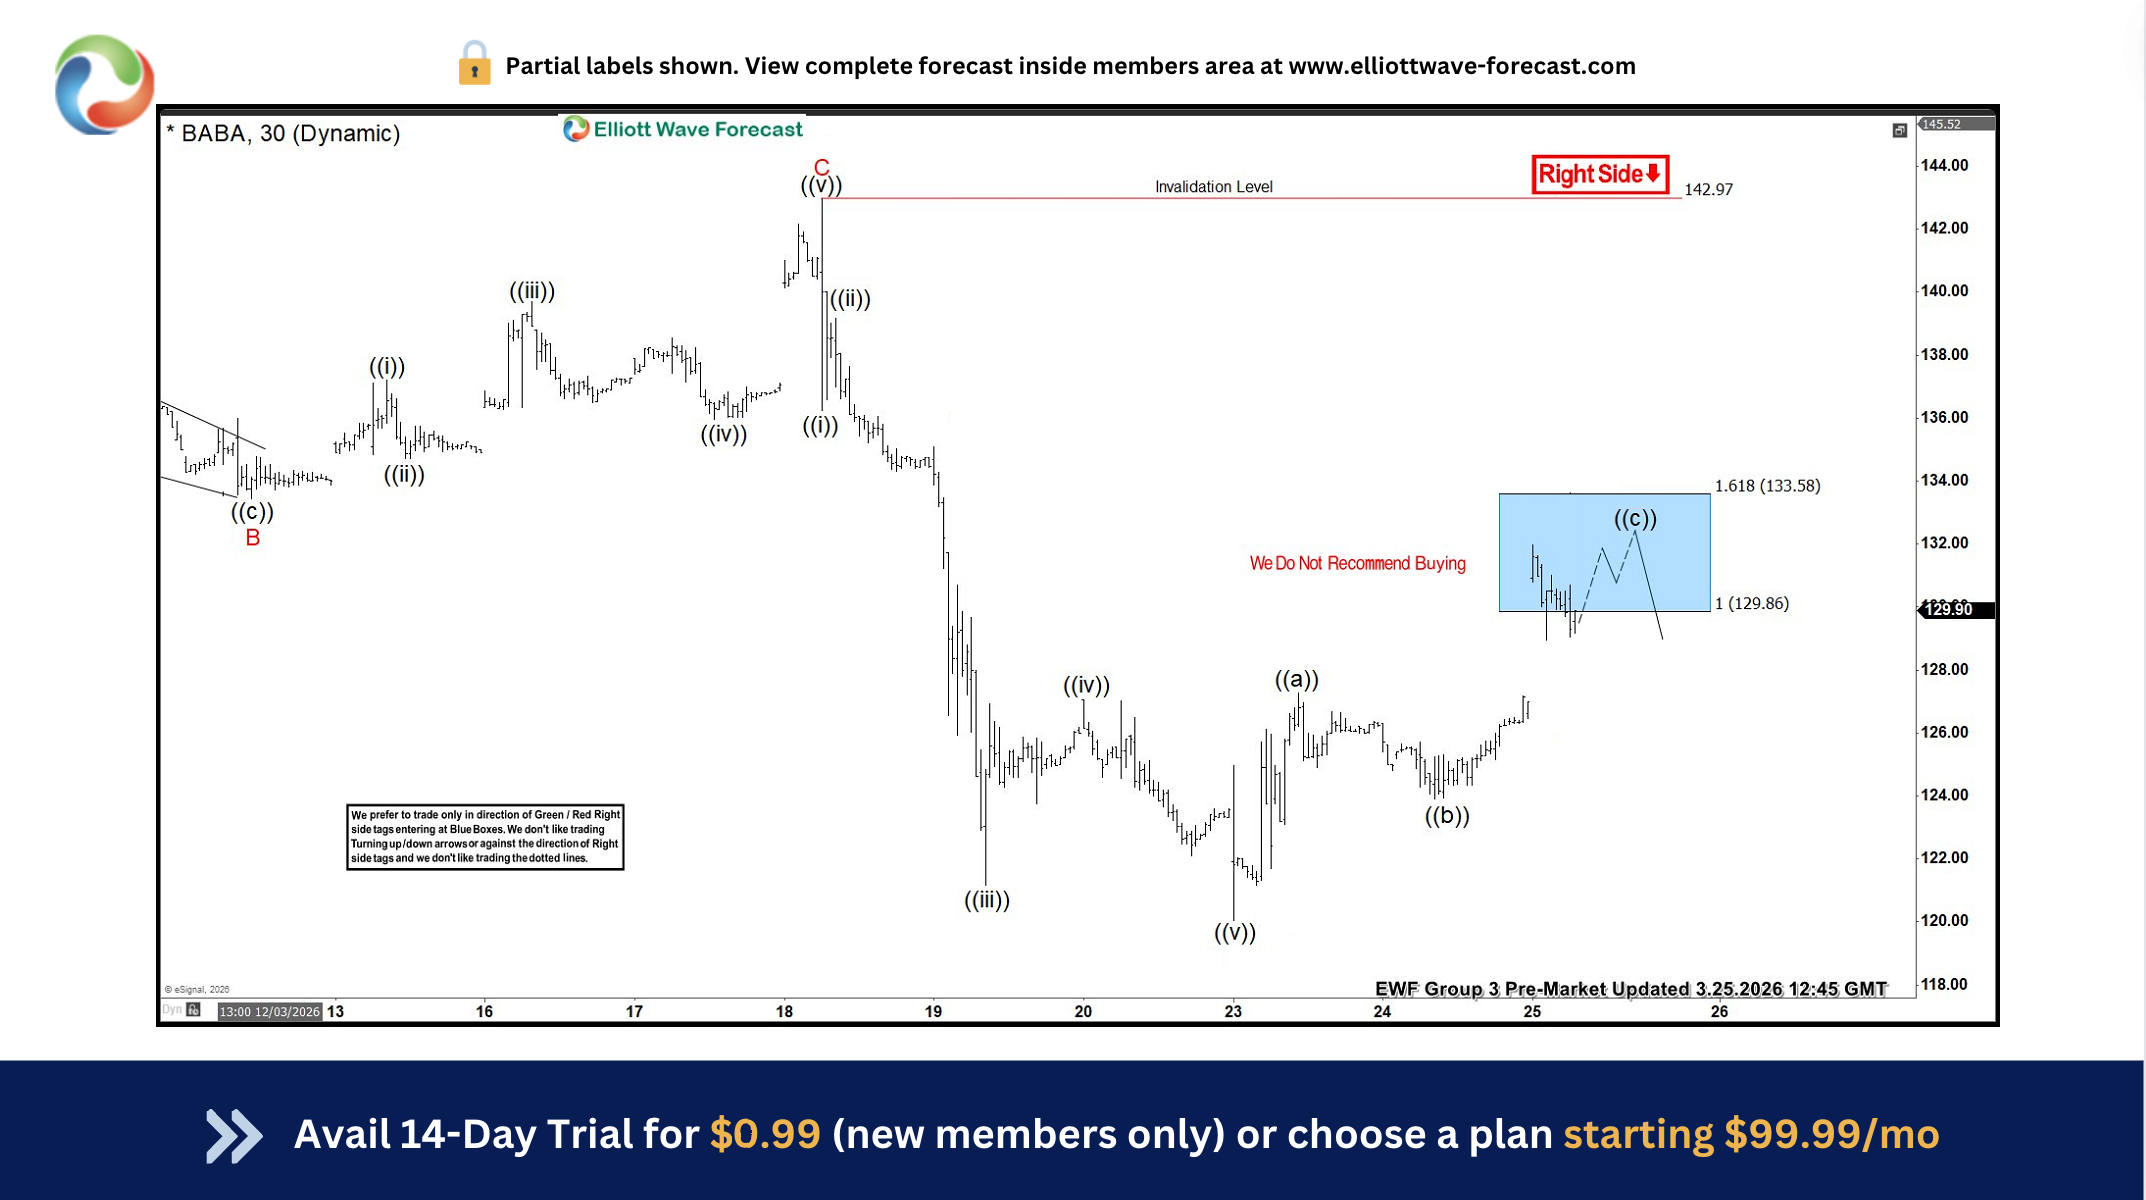
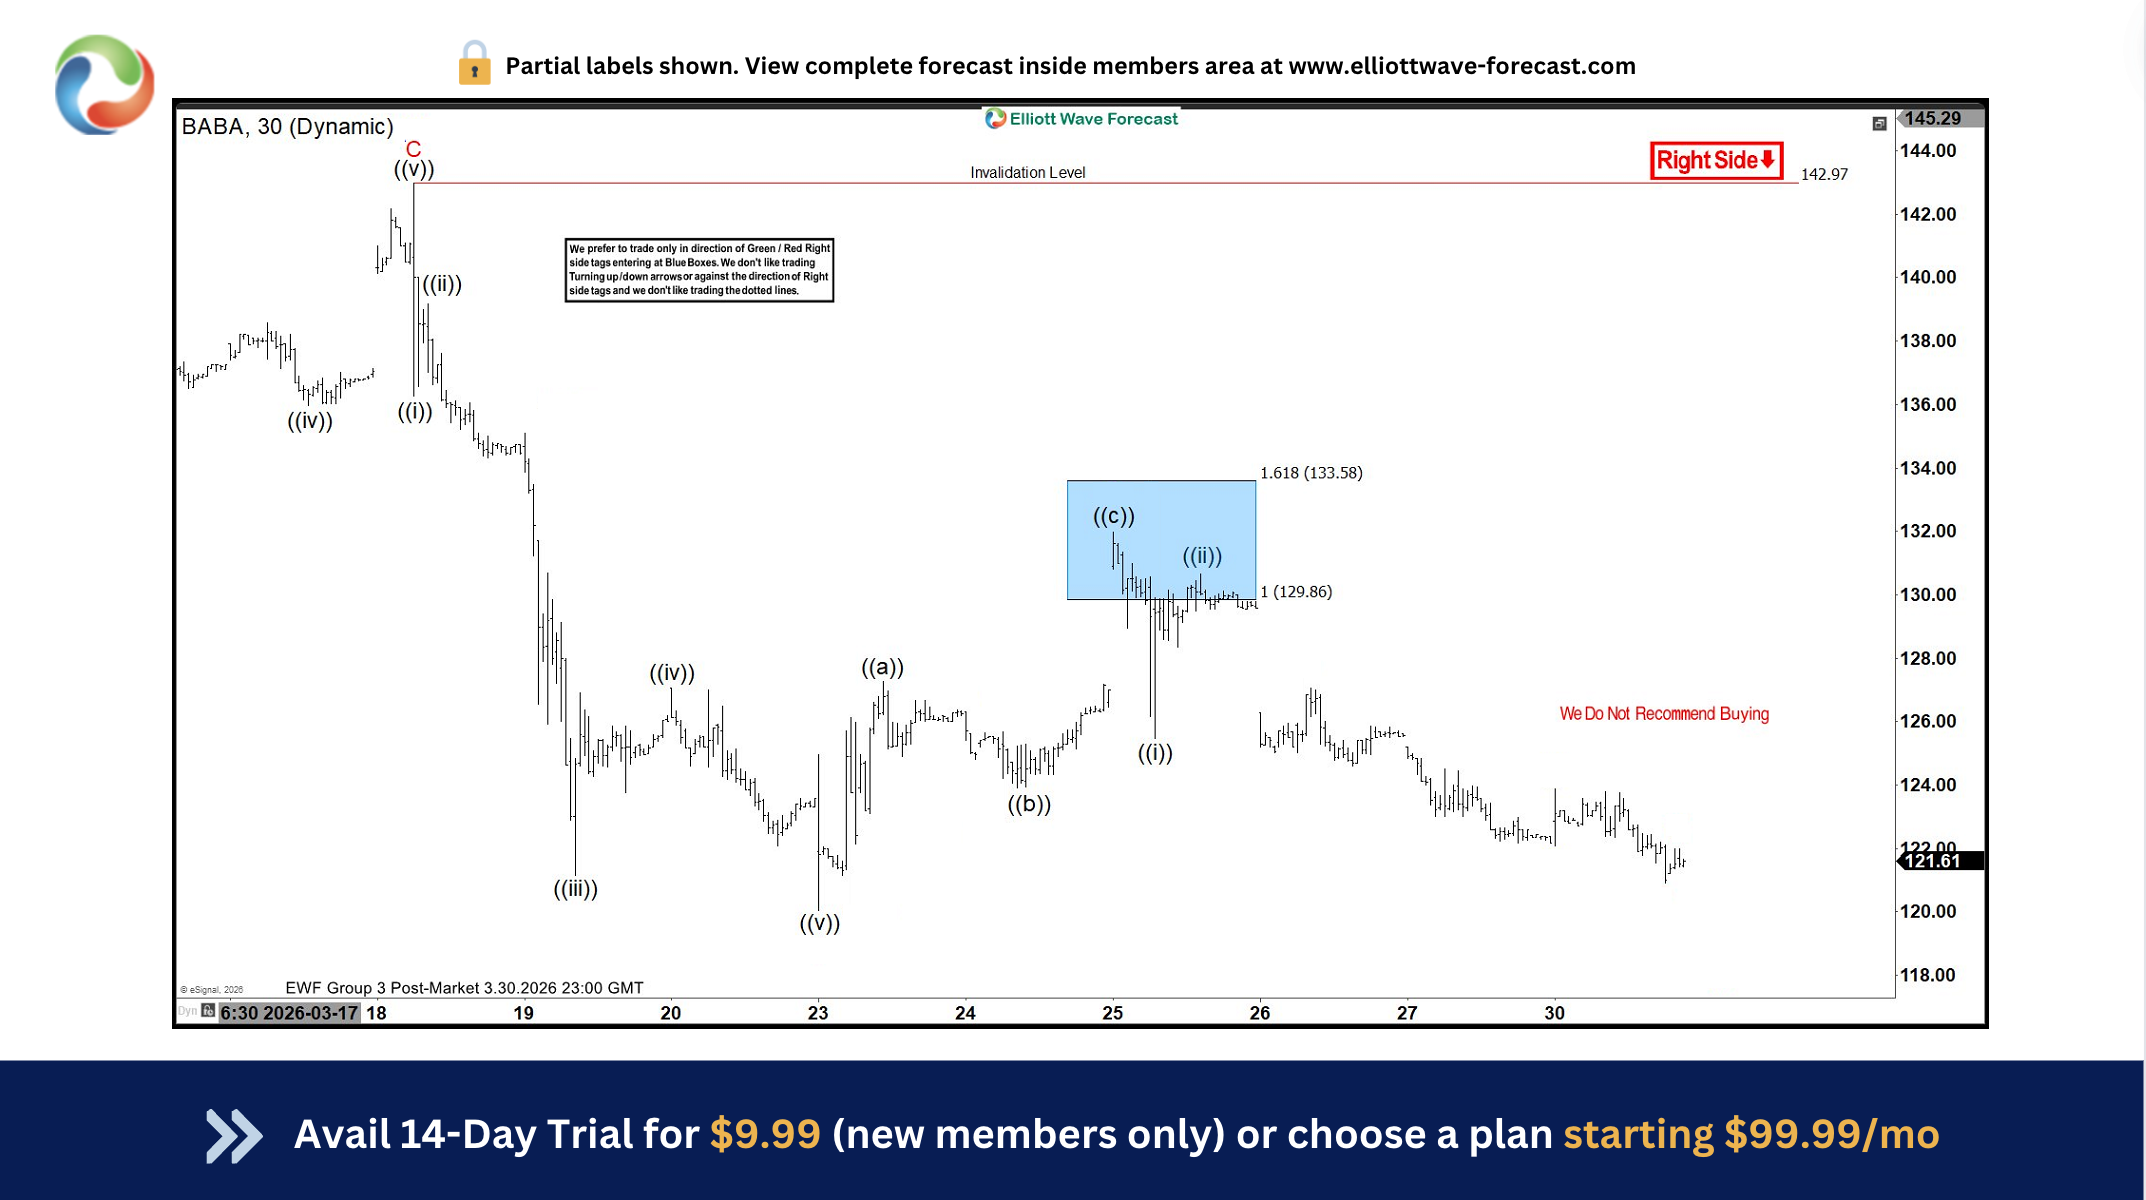
$BABA Confirms Elliott Wave with Spot-On Blue Box Reversal
In this technical blog, we are going to take a look at the past performance of BABA 1-Hour Elliott wave Charts that we presented to our members. In which, the decline from 3.18.2026 high took place in an impulse sequence and showed a lower sequence calling for more downside to happen. Therefore, our
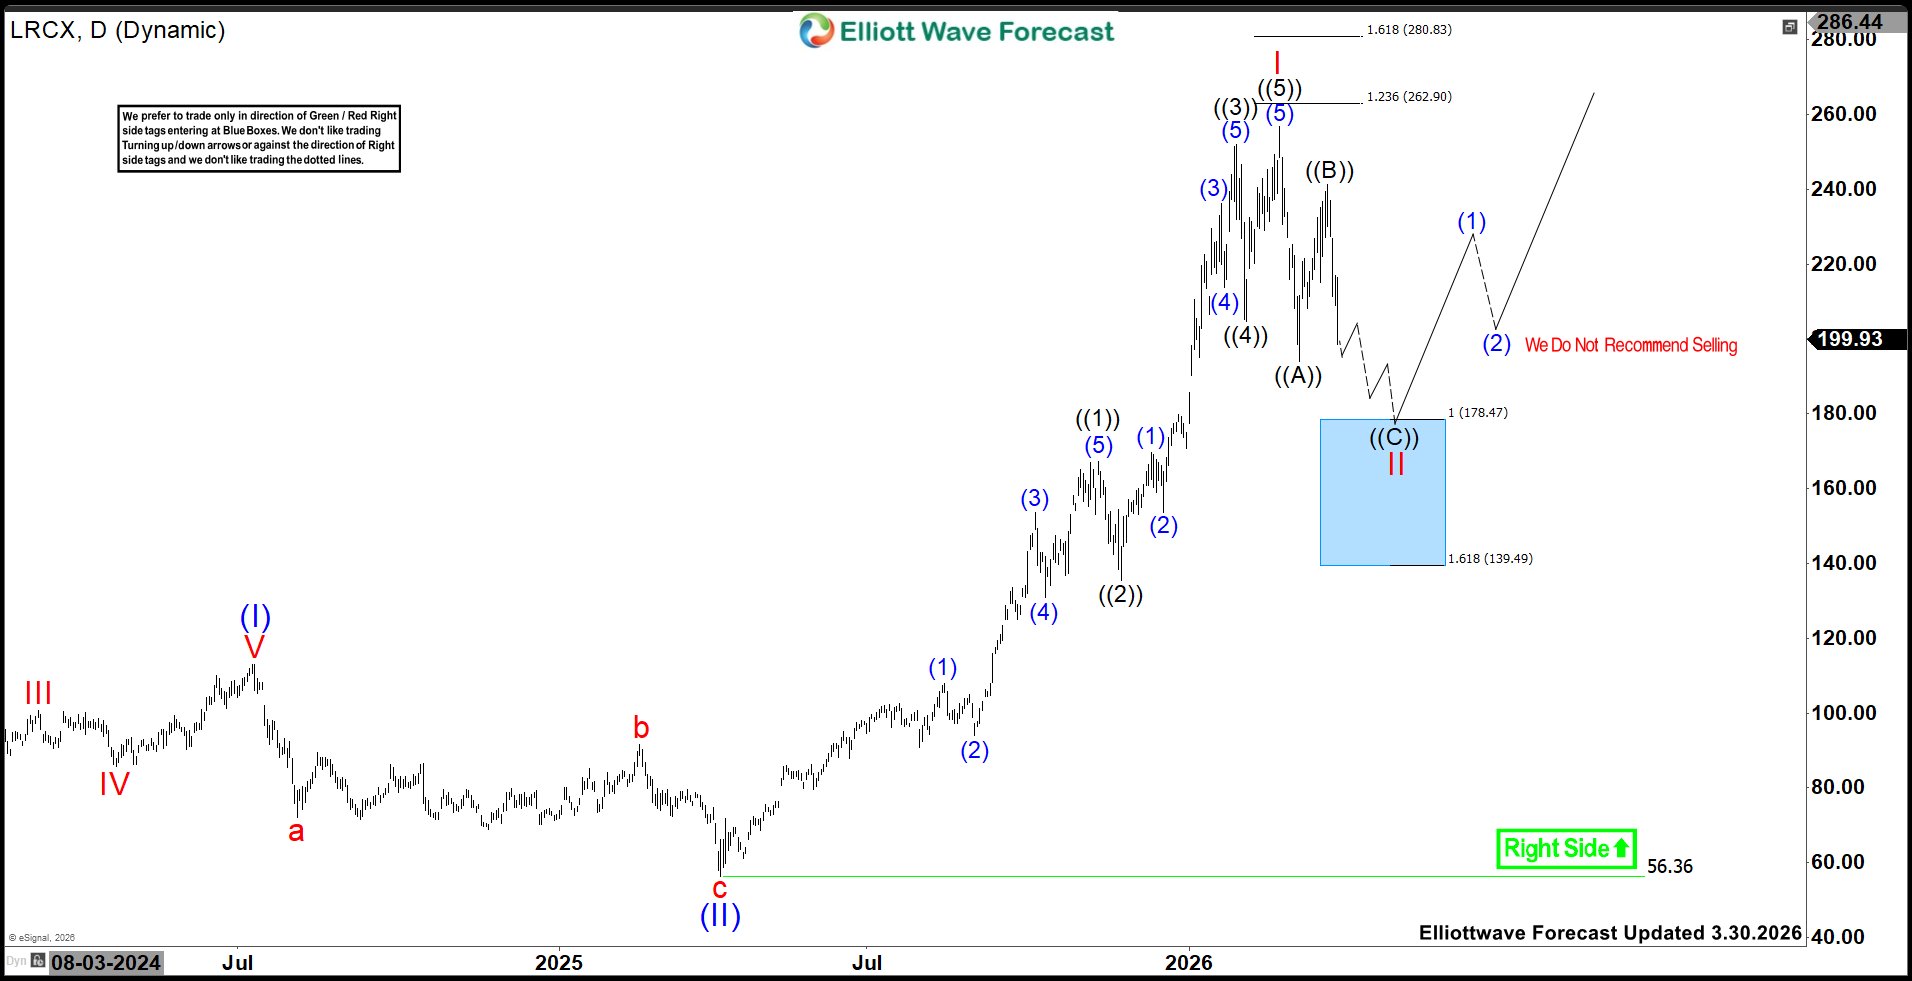
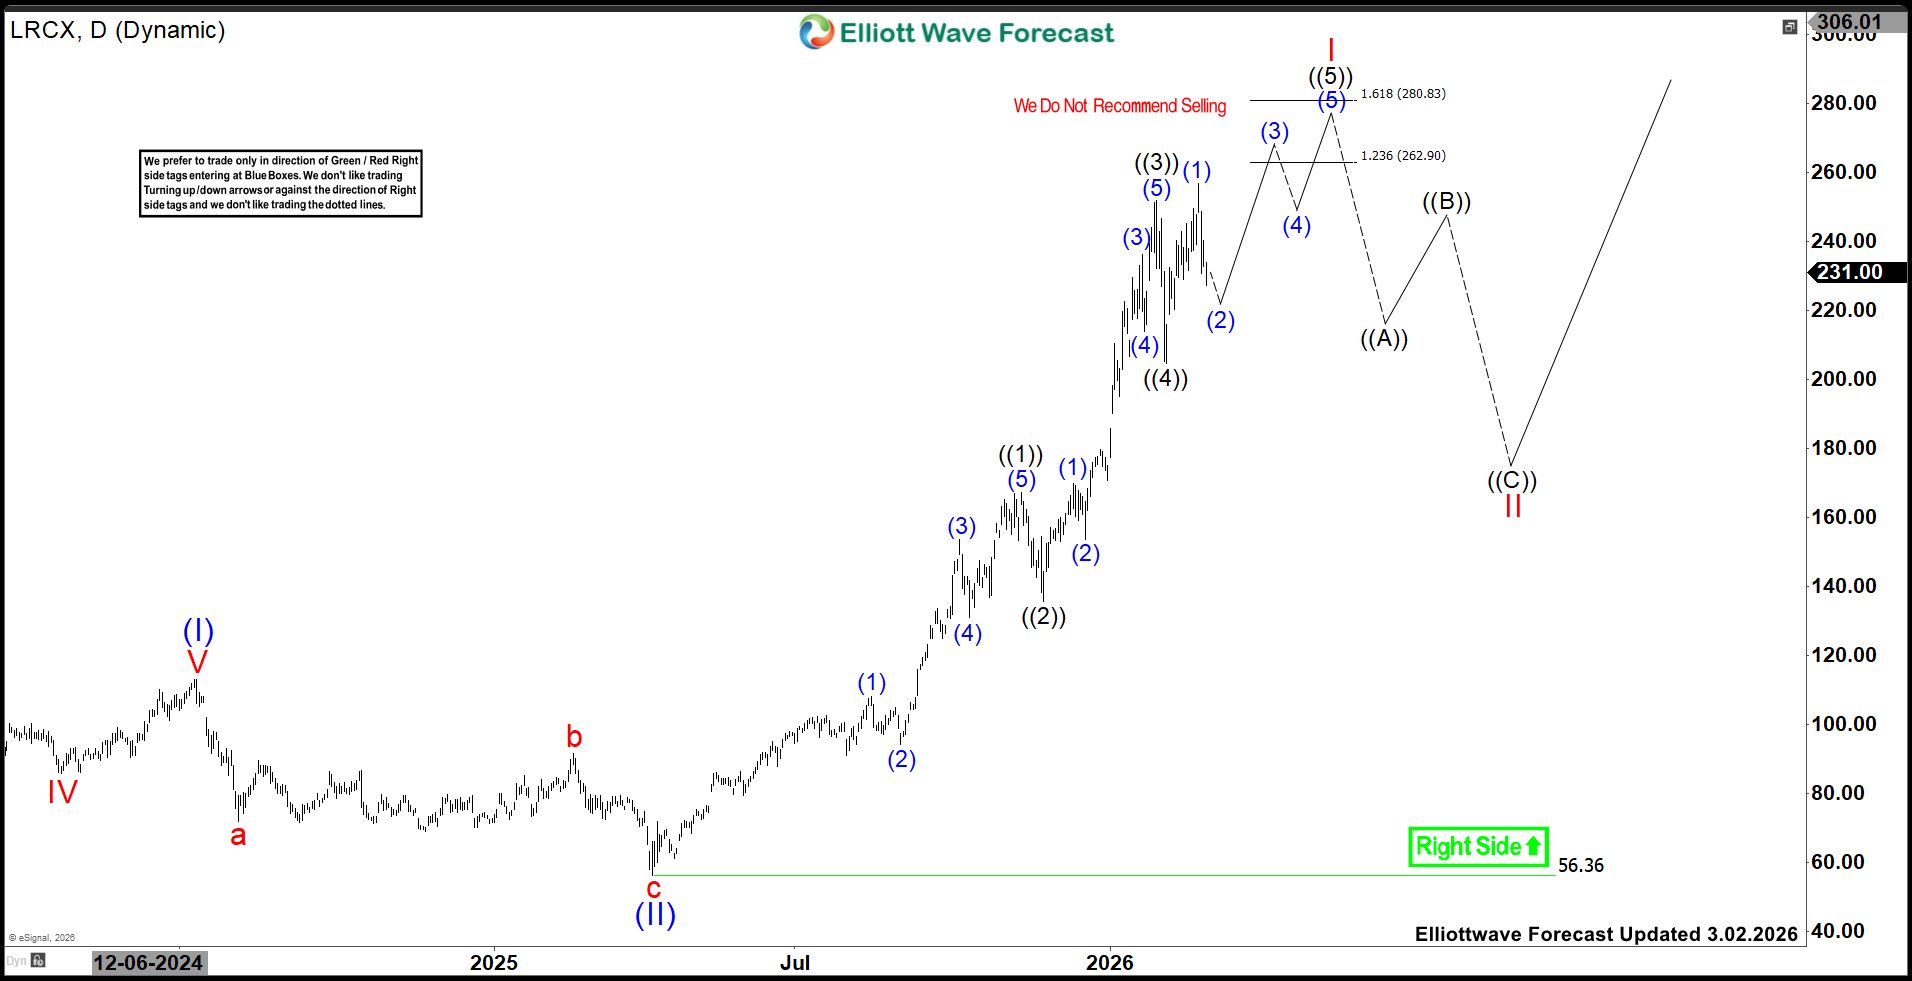
LRCX Elliott Wave Analysis: Buyers Eye $178.5–$139.5 Support Zone
Lam Research Corporation (LRCX) designs, manufactures, markets, refurbishes & services semiconductor processing equipment used in the fabrication of integrated circuits in the US, China, Korea, Taiwan, Japan, Southeast Asia & Europe. It comes in Technology Semiconductor sector & trades a