Elliott Wave Suggests AT&T Inc. (T) Last Leg Lower Could Have Started

AT&T Inc. (T) is an American multinational telecommunications holding company headquartered in Dallas, Texas. It is the world's largest telecommunications company by revenue and the third-largest provider of mobile telephone services in the U.S.
AT&T (T) Monthly Chart April 2024
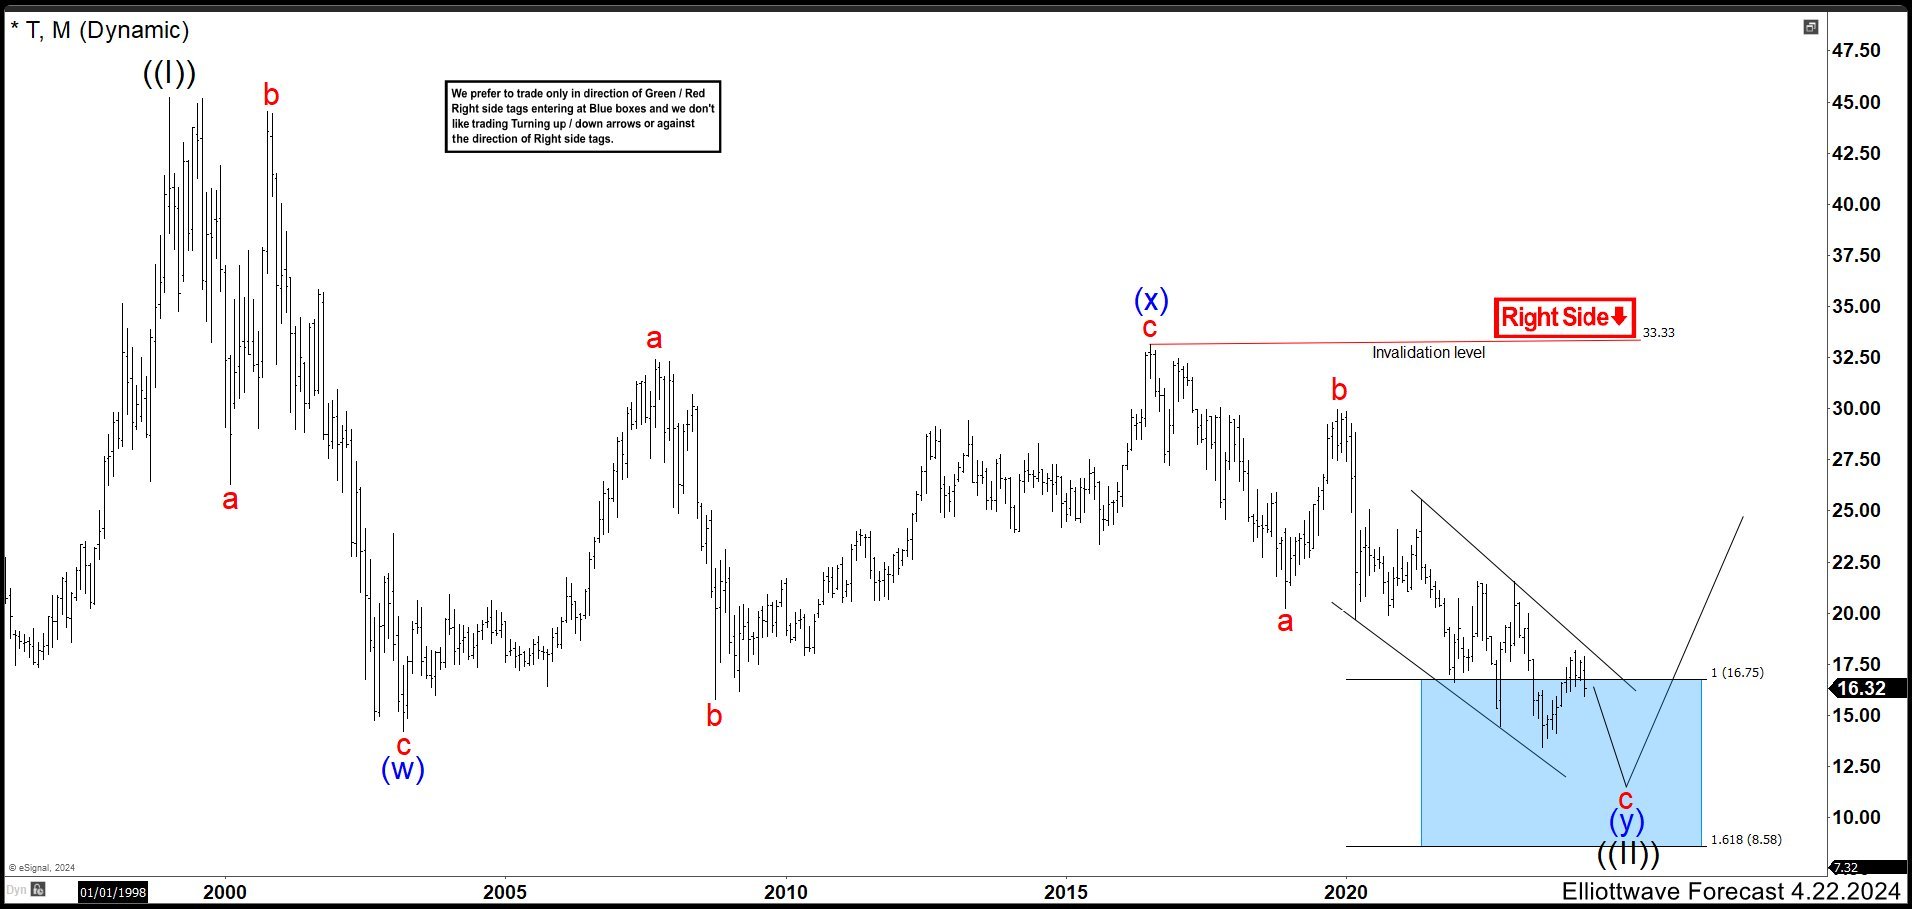
In the monthly chart above, we can see that AT&T shares finished an all-time high with a price of $45.23. Since the beginning of 1999, the value has held a downtrend and we are looking to end this correction. Using the Elliott Wave Principle, a double correction structure (w), (x) and (y) can be clearly seen. From the peak, we have 3 waves in a flat structure that ends wave (w) at $14.17 low. Then we have another flat structure that built a wave (x) ending in the value of $33.33 high.
The last leg of the double correction is the wave (y). We have already completed wave a and b, and we are developing wave c as an ending diagonal structure. The market has already reached the blue box in the $8.58 – $16.75 area, but with the current market conditions and the incomplete structure, the price should drop below $13.43.
AT&T (T) Weekly Chart April 2023
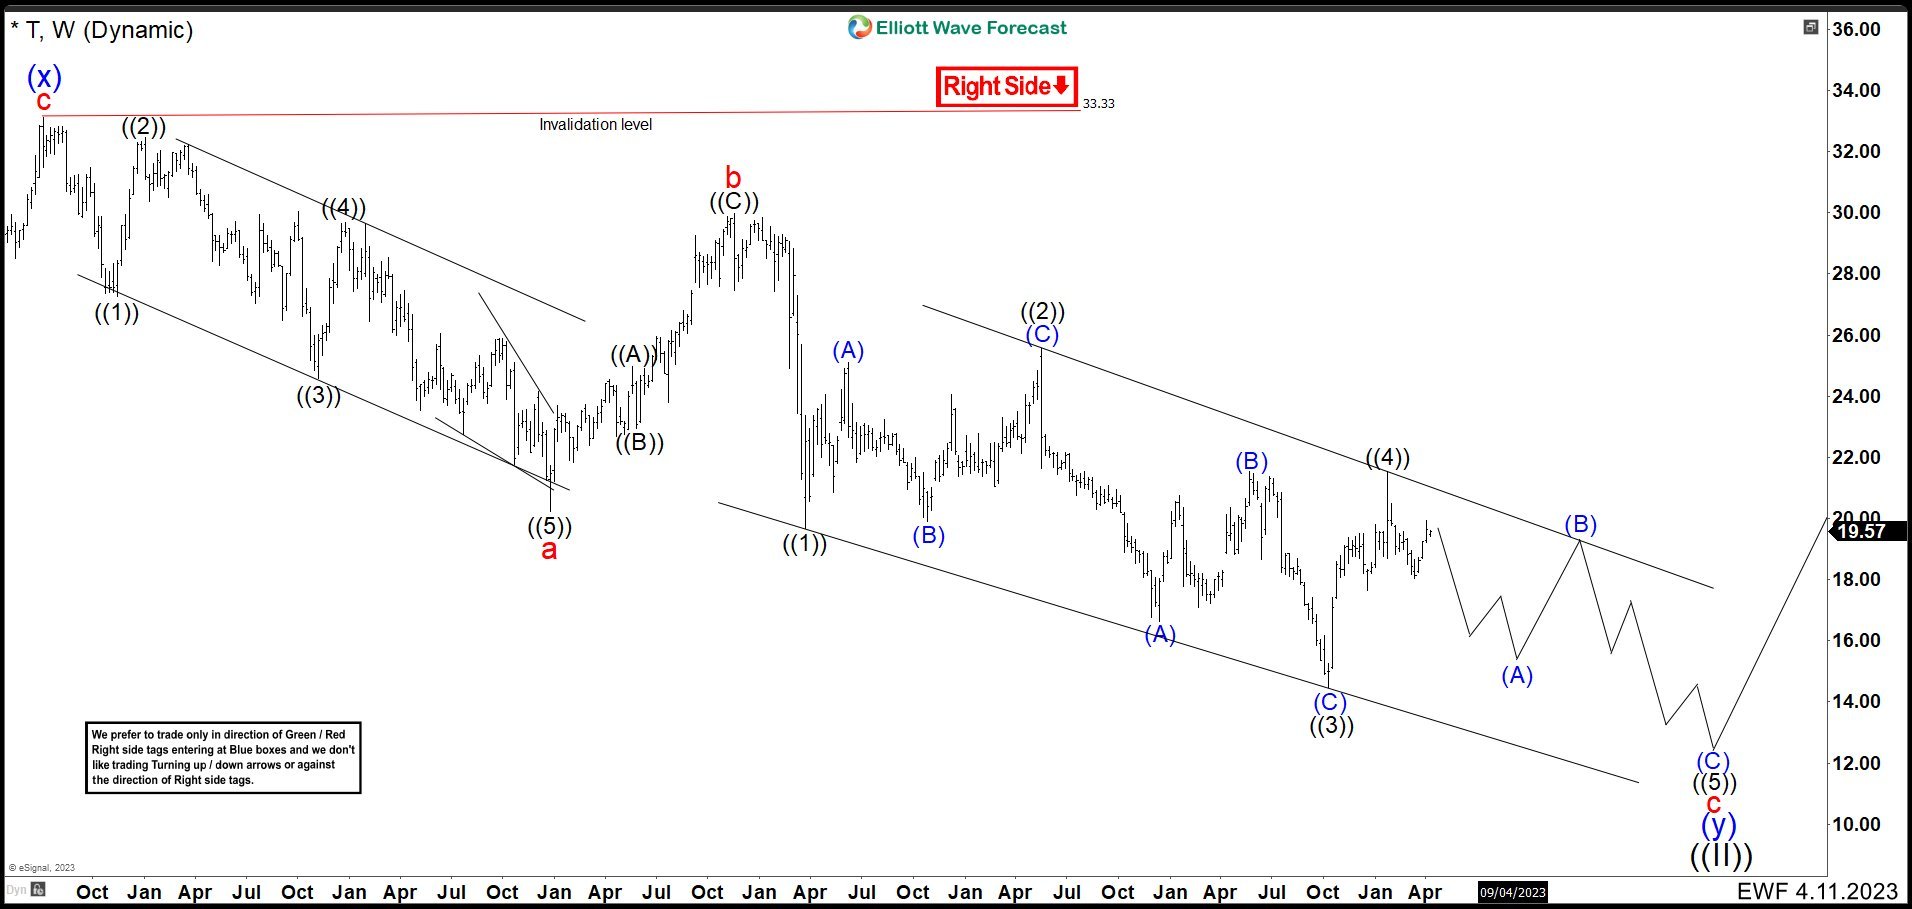
On the weekly chart one year ago, we can see in more detail the structure of the wave (y). Wave a in red made a leading diagonal that ended at $20.21 low. Then it bounced in 3 waves ending wave b at $29.96 high to continue sharply lower. Wave c has taken the form of an ending diagonal and it needed 3 more waves lower that break the price of $14.17 to confirm the structure.
AT&T (T) Weekly Chart April 2024
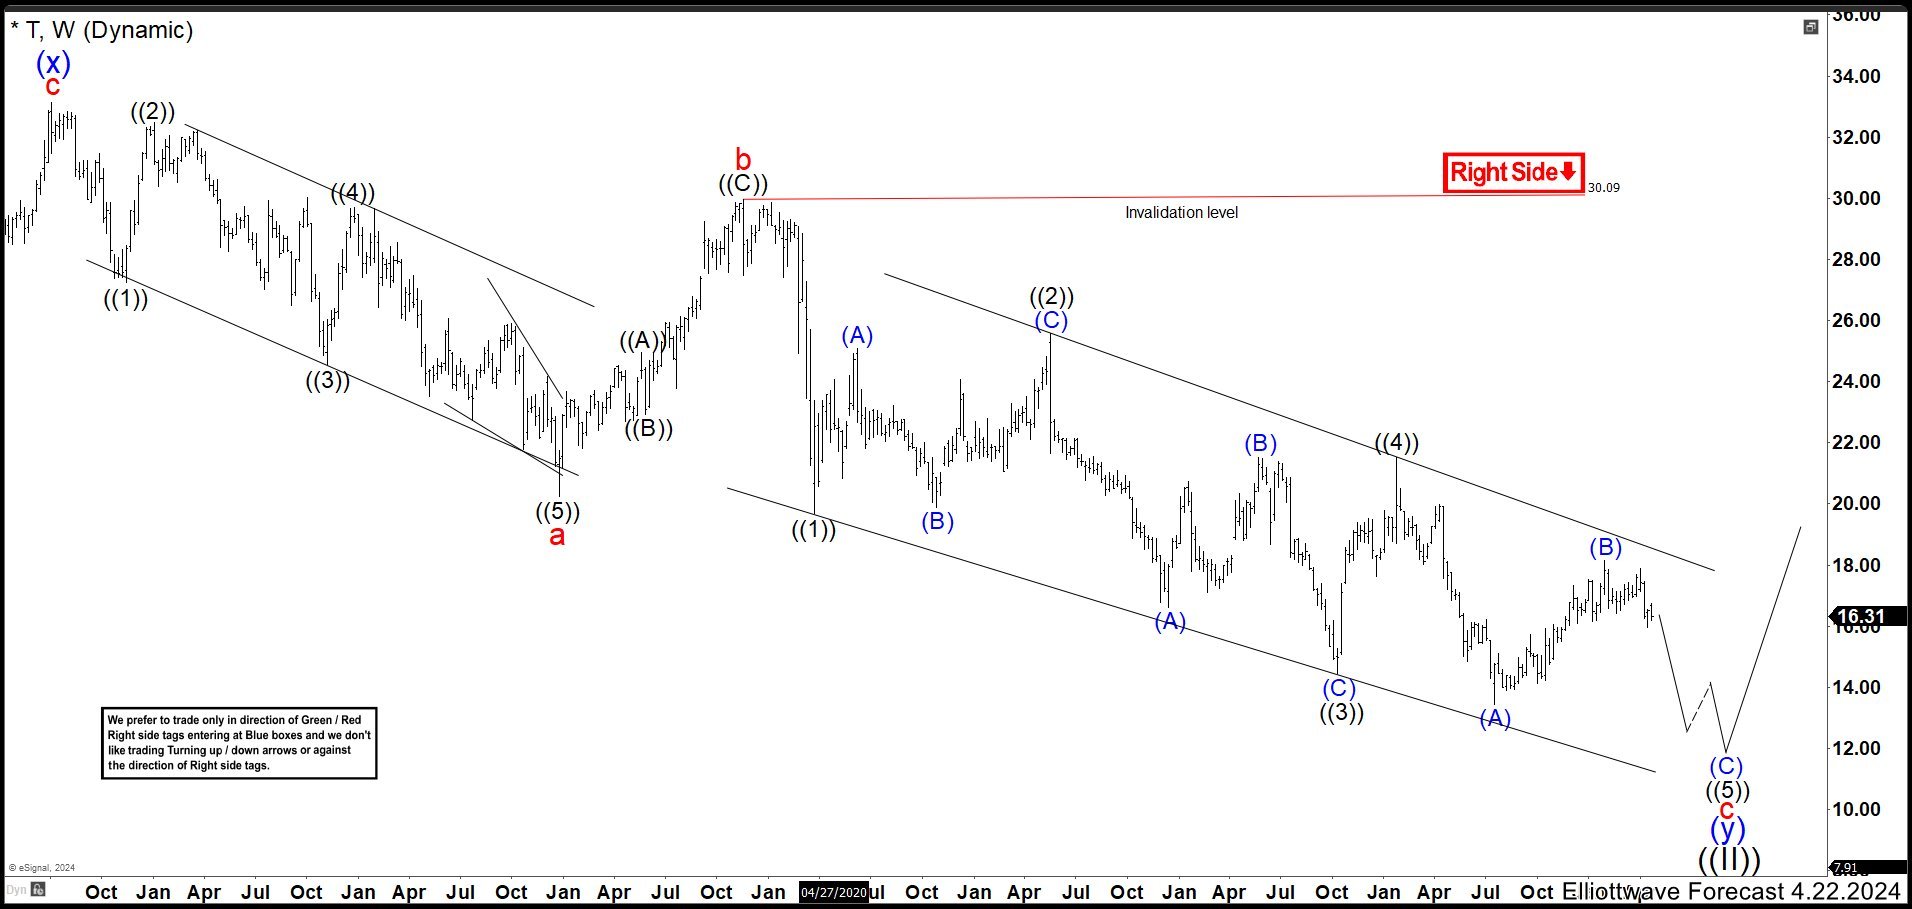
After a year, T continued lower as expected breaking $14.17 low. This drop completed wave (A) at $13.43 low. The next rally ended wave (B) at $18.16 high and it should continue to the downside breaking $13.43 low to confirm the current view. Therefore, the ending diagonal as wave c should finsih around $10.00 and the whole correction of wave ((II). In this place, the market should . If market develops another structure and remain moving to the downside, T could go down to the chilling value of $2.00.
Disclaimer: The content above represents only the views of the author or guest. It does not represent any views or positions of FOLLOWME and does not mean that FOLLOWME agrees with its statement or description, nor does it constitute any investment advice. For all actions taken by visitors based on information provided by the FOLLOWME community, the community does not assume any form of liability unless otherwise expressly promised in writing.
FOLLOWME Trading Community Website: https://www.followme.com


Hot
No comment on record. Start new comment.