Elliott Wave Analysis on Tesla (TSLA): Is Correction Over?

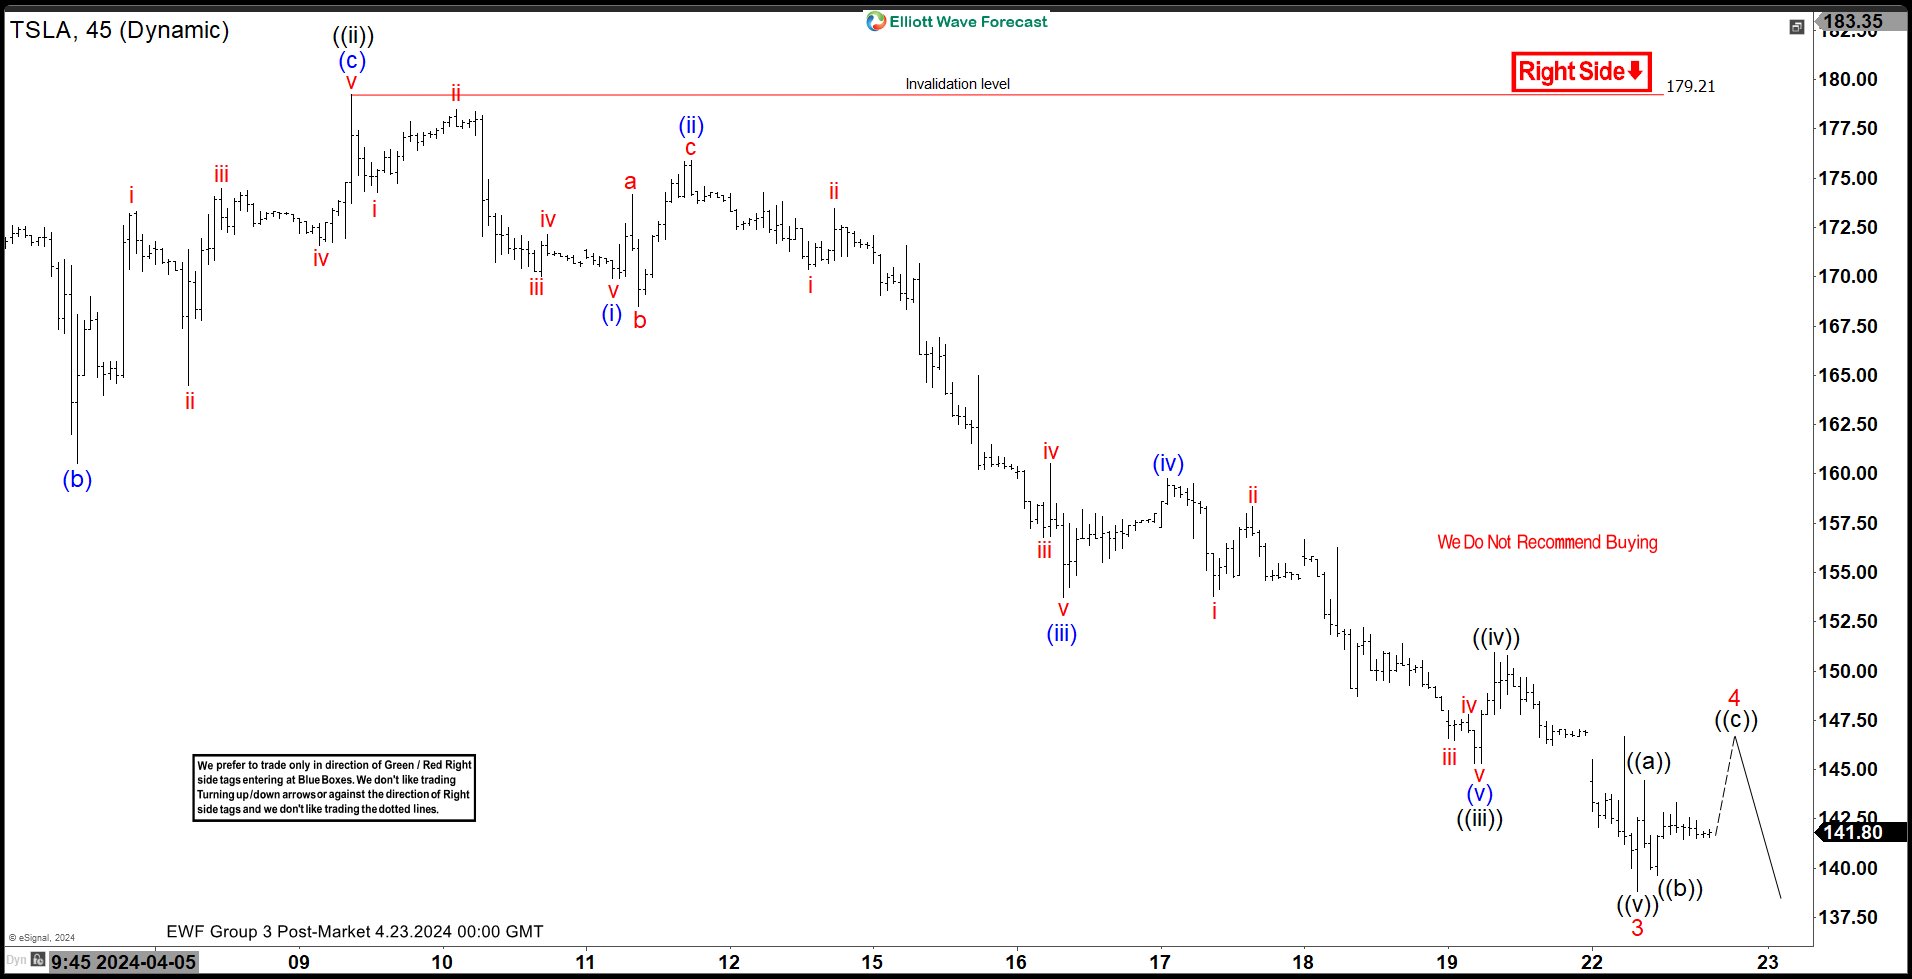
Short Term Elliott Wave view on Tesla (TSLA) suggests decline from 2.27.2024 high is in progress as a 5 waves impulse lower. Down from 2.27.2024 high, wave 1 ended at 160.51 and rally in wave 2 ended at 184.25. Down from there, wave ((i)) ended at 162.01. Wave ((ii)) rally ended at 170.21 as the 45 minutes chart below shows. Down from wave ((ii)), wave (i) ended at 169.90 and wave (ii) rally ended at 175.88. The stock extended lower in wave (iii) towards 153.75 and wave (iv) ended at 159.79. Expect the stock to extend lower in wave (v) towards 145.3 which completed wave ((iii)).
The stock bounced in wave ((iv)) ended at 150.94 and the stock turned lower in wave (v) towards 138.80. This completed wave 3 in higher degree. Wave 4 bounce is in progress to correct cycle from 3.26.2024 high in 3, 7, or 11 swing before the stock extends lower. Near term, as far as pivot at 179.2 high stays intact, expect rally to fail in 3, 7, or 11 swing for further downside. Potential support area is 100% - 161.8% Fibonacci extension from 7.19.2023 high. This area comes at 95.4 - 160.2. Thus, the stock is already in the support zone and thus can end the correction anytime and turns higher.
Tesla (TSLA) 45 Minutes Elliott Wave Chart
Disclaimer: The content above represents only the views of the author or guest. It does not represent any views or positions of FOLLOWME and does not mean that FOLLOWME agrees with its statement or description, nor does it constitute any investment advice. For all actions taken by visitors based on information provided by the FOLLOWME community, the community does not assume any form of liability unless otherwise expressly promised in writing.
FOLLOWME Trading Community Website: https://www.followme.com


Hot
No comment on record. Start new comment.