EURGBP Elliott Wave : Selling The Rallies at Blue Box Area

Hello fellow traders. In this technical article we’re going to take a quick look at the Elliott Wave charts of EURGBP published in members area of the website. Our team recommended members to avoid buying , while keep favoring the short side in the pair. Recently we got recovery that reached our selling zone. The pair found sellers and made reaction from the blue box as expected. In the further text we are going to explain the Elliott Wave Forecast and trading strategy.
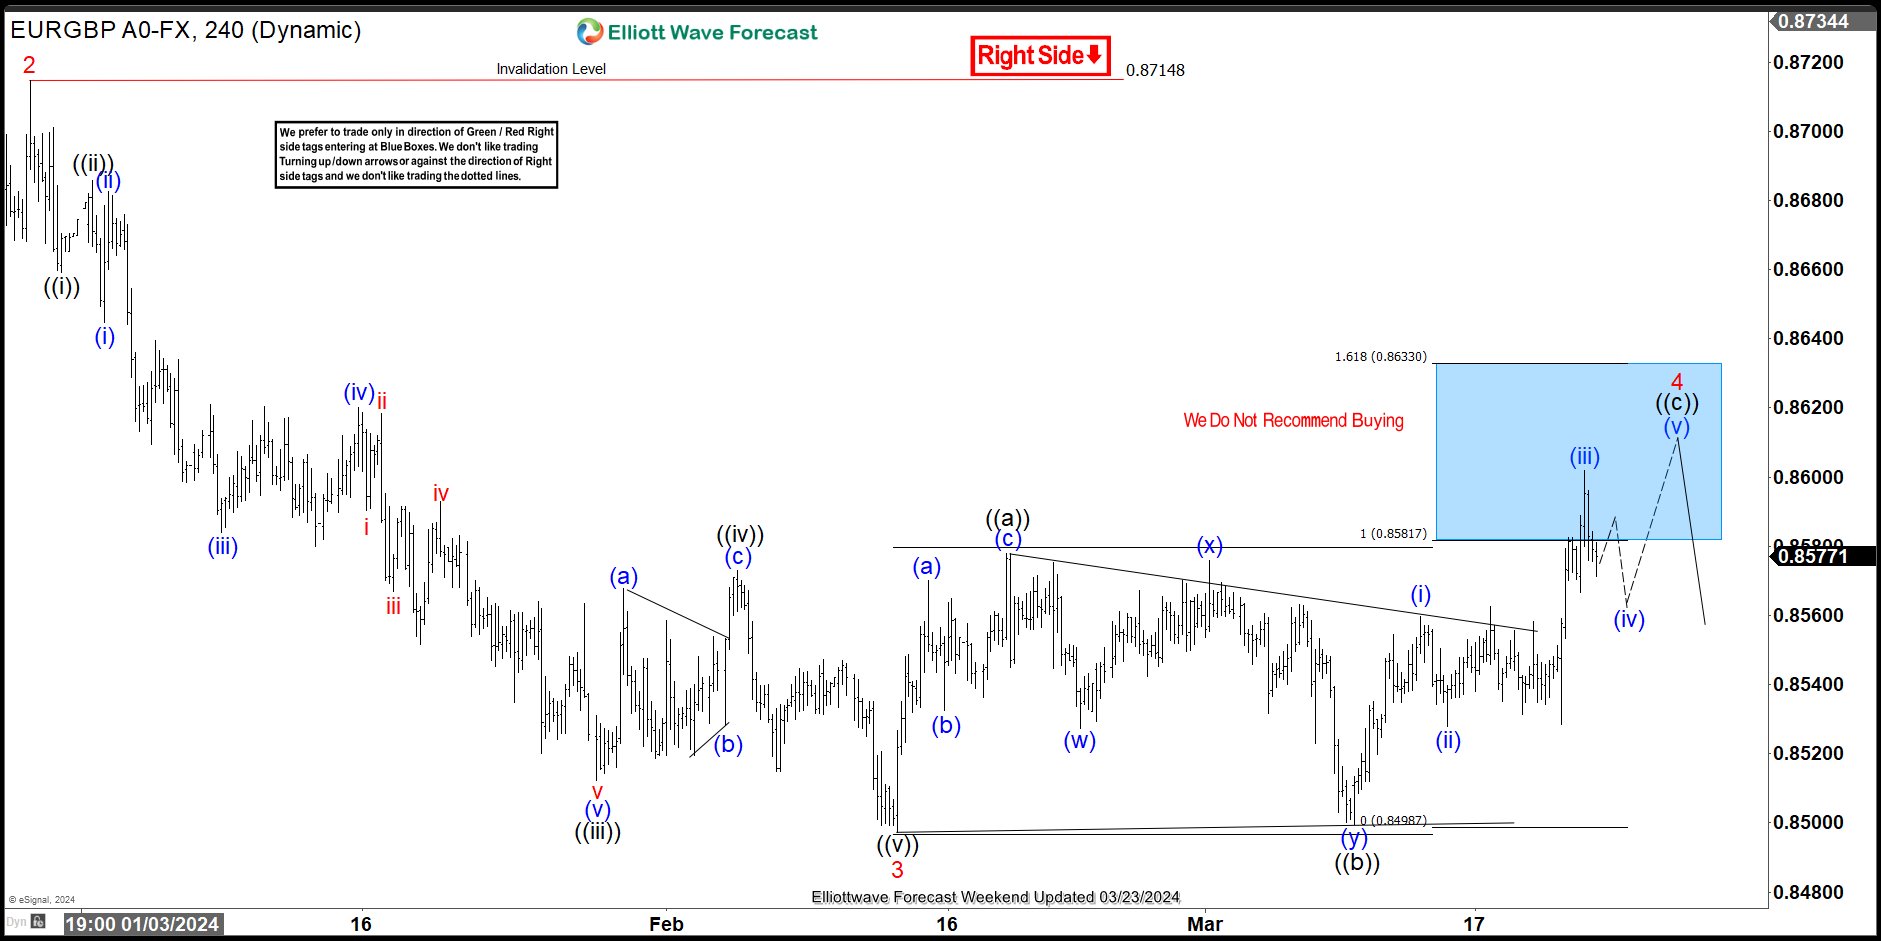
EURGBP Elliott Wave 4 Hour Chart 03.23.2024
The pair is correcting the cycle from the 0.87148 peak , giving us 4 red recovery. The price has already reached the extreme zone at 0.85817-0.86330 (Blue Box – sellers zone). So, we are aware that another marginal push up may or may not be seen within the blue box. Alternatively, 4 red can be already completed at the 0.86019 high as Elliott Wave Double Three Pattern. We don’t recommend buying the pair and prefer the short side from the blue box zone. As the main trend is bearish, we expect to see at least 3 waves pullback from our selling zone. Once the decline reaches 50 Fibs against the ((b)) black low, we will make the short position risk-free (put SL at BE) and take partial profits. Invalidation for the short trades is a break above 1.618 fib ext: 0.8633.
Quick reminder:
Our charts are easy to trade and understand:
Red bearish stamp+ blue box = Selling Setup
Green bullish stamp+ blue box = Buying Setup
Charts with Black stamps are not tradable. 🚫
You can learn more about Elliott Wave Patterns at our Free Elliott Wave Educational Web Page.
EURGBP Elliott Wave 4 Hour Chart 04.13.2024
The pair found sellers at the Blue Box area: 0.85817-0.86330. The recovery completed at the 0.86019 high, and we are receiving a good reaction from the selling zone. The decline reached and exceeded 50 fibs against the connector’s low. So, members who took the short trade are currently enjoying profits in risk-free positions. While below the 0.86019 high, the next leg down can be in progress toward new lows.
Keep in mind that market is dynamic and presented view could have changed in the mean time. You can check most recent charts in the membership area of the site. Best instruments to trade are those having incomplete bullish or bearish swings sequences. We put them in Sequence Report and best among them are shown in the Live Trading Room

Disclaimer: The content above represents only the views of the author or guest. It does not represent any views or positions of FOLLOWME and does not mean that FOLLOWME agrees with its statement or description, nor does it constitute any investment advice. For all actions taken by visitors based on information provided by the FOLLOWME community, the community does not assume any form of liability unless otherwise expressly promised in writing.
FOLLOWME Trading Community Website: https://www.followme.com


Hot
No comment on record. Start new comment.