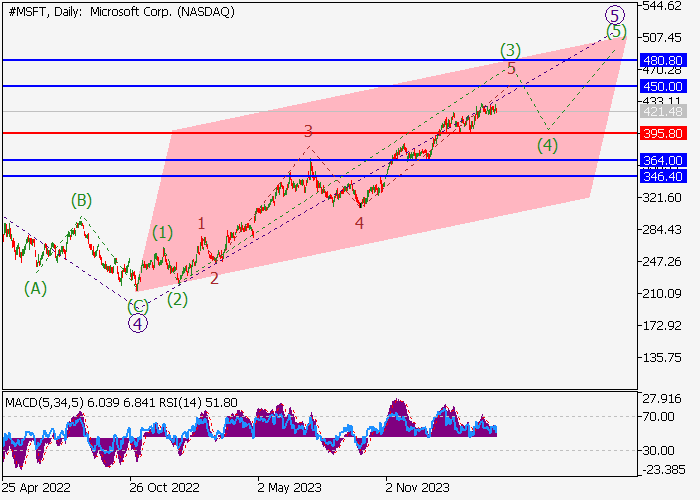
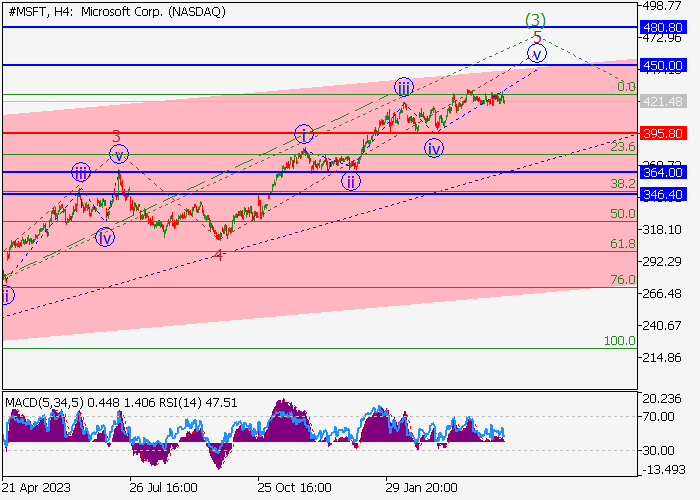
On the daily chart, the third wave of the higher level 3 ended, a downward correction formed as the fourth wave 4, and the fifth wave 5 develops, within which the wave (3) of 5 forms. Now, the fifth wave of the lower level 5 of (3) is forming, within which the wave v of 5 is developing. If the assumption is correct, the asset will grow to the levels of 450.00–480.80. In this scenario, critical stop loss level is 395.80.
Main scenario
Long positions will become relevant above the level of 395.80 with the targets at 450.00–480.80. Implementation period: 7 days and more.
Alternative scenario
A breakout and the consolidation of the price below the level of 395.80 will let the asset go down to the area of 364.00–346.40.
Disclaimer: The views expressed are solely those of the author and do not represent the official position of Followme. Followme does not take responsibility for the accuracy, completeness, or reliability of the information provided and is not liable for any actions taken based on the content, unless explicitly stated in writing.
Like this article? Show your appreciation by sending a tip to the author.



 No comments yet. Be the first to share your view.