*Gold Broke the Triangle –But Will It Be Able To Retest Key Psychological Mark of 2050*
*Previous Trading Session*
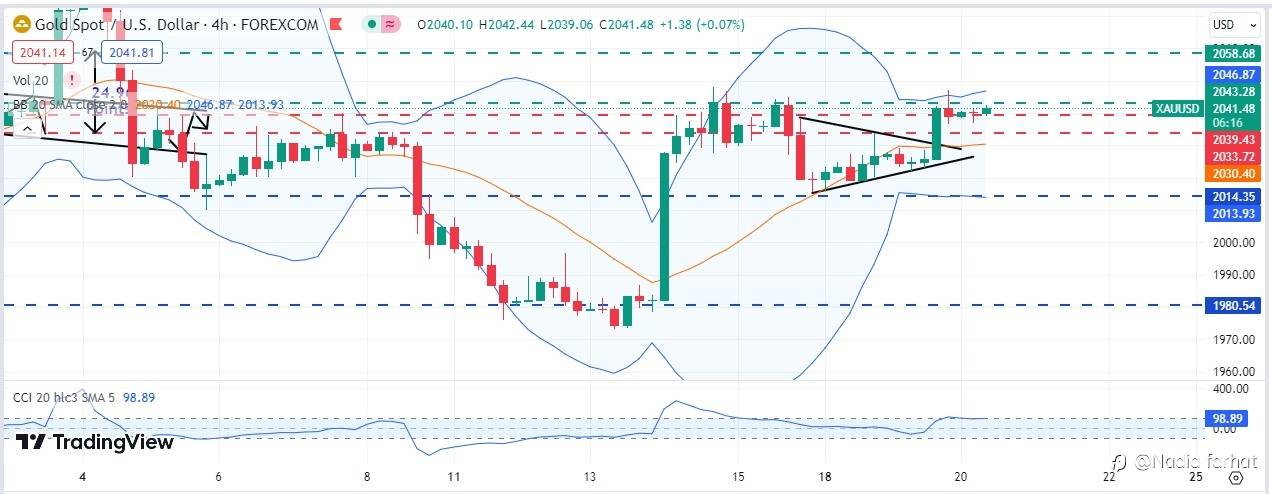
• On Tuesday, gold gave a bullish breakout out of the symmetrical triangle pattern and made highs of 2047.05,
• However, minor corrections were witnessed from the highs and gold ended the trading day above 2039.43.
*Current Situation*
• On Wednesday, gold looks steady near 2-week highs near 2040.
• It has sustained above the key support of 2039.43, which was previously acting as resistance.
*Analysis*
• The gold seems to be driven by the weakness in the US dollar.
• The US treasury yield on the benchmark 10-year note was down about 2 basis points at 3.933%, having fallen below 4%.
• Further, Sticky inflation in the Euro Zone raises the probability of further rate hikes, which has negatively impacted dollar prices.
• On Tuesday, Euro Zone announced a little lower inflation data, but experts still find inflation on the higher side and express higher probabilities of rate hikes in the upcoming months.
• Higher Inflation -> rate hikes in Euro Zone -> provide minor strength to Euro -> weaken US dollar -> strengthen gold
• Furthermore, bullish sentiments favoring gold receive support from geopolitical risks and concerns regarding an economic slowdown in China.
*Technical Indicators:*
• Gold is currently trending in a buying zone as per technical indicators, which signals further bullishness.
• Gold on Wednesday hovers above the middle band of the Bollinger Band as visible on the attached H4 chart.
• The CCI levels also hover in the buying zone near 98.25 levels.
*Projection:*
• Nothing has changed for Gold and it still looks uncertain, hence, take your trades very cautiously.
• The choppy movement will continue till the US session, in which important CB Consumer Confidence and Existing Home Sales data is going to be released.
*Important Levels to Watch*
*It is noteworthy that our previously given levels during late November are still respected by the gold prices – as visible on the attached H4 chart of Gold*
• Resistance: A bullish acceptance above 2041.15 is significant for the Gold price to resume its journey higher toward the 2050 psychological level and 2058.68.
• Support: To begin a declining trend, gold must give a daily closing below 2033.72. Below the correction mode will begin with the next support at 2014.35
↘️⬇️⬇️⬇️⬇️⬇️⬇️⬇️⬇️⬇️⬇️⬇️⬇️⬇️⬇️⬇️↙️
To join our free premium group. DM me
#XAU/USD# #gold# #GOLDTODAY# #CanGoldRetake2000?# #Commodities# #Metals# #preciousmetal# #forexmarket# #FOREX# #Todayanalysis# #analysis# #fundamentalsanalysis# #technicalanalysis#
Disclaimer: The views expressed are solely those of the author and do not represent the official position of Followme. Followme does not take responsibility for the accuracy, completeness, or reliability of the information provided and is not liable for any actions taken based on the content, unless explicitly stated in writing.

Leave Your Message Now