


| Scenario | |
|---|---|
| Timeframe | Weekly |
| Recommendation | SELL STOP |
| Entry Point | 151.95 |
| Take Profit | 148.00 |
| Stop Loss | 154.00 |
| Key Levels | 148.00, 152.00, 155.00, 158.00 |
| Alternative scenario | |
|---|---|
| Recommendation | BUY STOP |
| Entry Point | 155.05 |
| Take Profit | 158.00 |
| Stop Loss | 153.00 |
| Key Levels | 148.00, 152.00, 155.00, 158.00 |
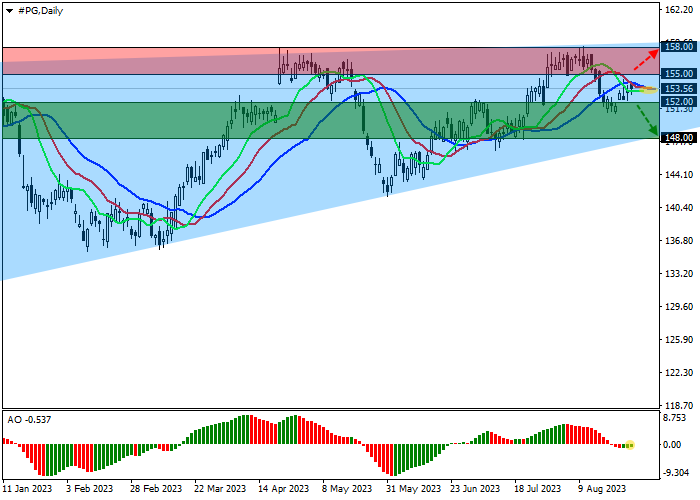
Shares of The Procter & Gamble Co., one of the leaders in the global consumer goods market, are moving within a corrective trend at 153.00.
On the daily chart, the price is approaching the support level of the global Triangle pattern with dynamic boundaries of 148.00–158.00. Since the asset has not yet entered the last third of the formation, the probability of breaking the level is low.
On the four-hour chart, a local Flag pattern with dynamic boundaries of 154.00–152.00 formed, which implementation is close and, most likely, will occur downwards.
Technical indicators keep a poor downward signal: fast EMAs on the Alligator indicator are close to the signal line, and the AO histogram forms corrective bars below the transition level.
Trading tips
Short positions may be opened after the price drops and consolidates below 152.00 with the target at 148.00. Stop loss – 154.00. Implementation period: 7 days or more.
Long positions may be opened after the price rises and consolidates above 155.00 with the target at 158.00. Stop loss – 153.00.
Disclaimer: The views expressed are solely those of the author and do not represent the official position of Followme. Followme does not take responsibility for the accuracy, completeness, or reliability of the information provided and is not liable for any actions taken based on the content, unless explicitly stated in writing.
 No comments yet. Be the first to share your view.