Weekly Waves: Ethereum, GBP/USD, and Gold

Our weekly analysis on Elliott Waves takes a close look at the GBP/USD, the Ethereum cryptocurrency, and the Gold commodity.
Our analysis indicates a bearish ABC correction on the GBP/USD, a potential 5 waves down on ETH/USD, and a slow wave 4 pattern on XAU/USD.
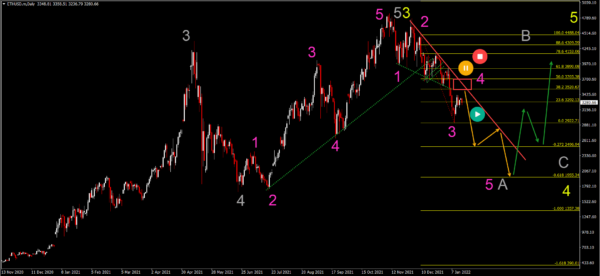
ETH/USD downtrend must respect shallow Fibs
The Ethereum (ETH/USD) cryptocurrency pair is in a downtrend after breaking below the support trend lines (dotted green):
- Price action could be moving down lower in 5 waves (pink). But price action should respect the shallow Fibonacci levels (red box) and resistance trend line (red).
- A break above these Fib levels place the bearish analysis on hold. A bearish bounce and continuation lower, however, could confirm the 5 wave pattern in wave A (grey).
- The main targets of the bearish swing are the -27.2% and -61.8% Fibonacci targets.
- In any case, a larger ABC (grey) pattern seems to be taking place in a wave 4 (yellow) correction.
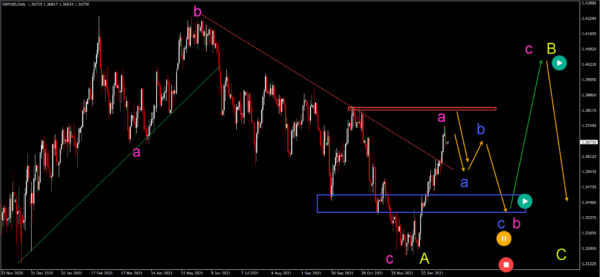
GBP/USD strength expected to face opposition
The GBP/USD is showing a strong bullish impulse, which was able to break above the resistance trend line (red) of the downtrend:
- The bulls however are facing a strong resistance zone from the previous top (red box). A bearish bounce is likely to occur here (orange arrows).
- A bearish ABC (blue) pattern could emerge at the resistance to create a pullback. But this could simply complete a wave B (pink) within a larger ABC (pink) pattern.
- The blue box could indicate an inverted head and shoulders pattern. A deeper bearish retracement would place the bullish ABC on hold or invalidate it. A stronger push up above the resistance (red box) however still will indicate a wave A (pink) most likely
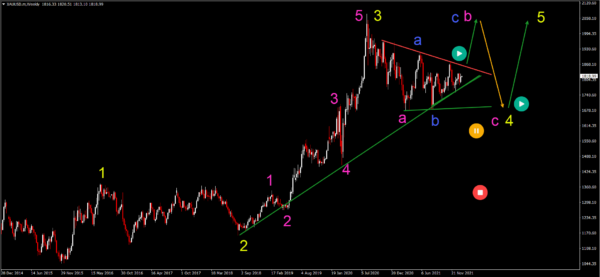
XAU/USD bullish chart pattern
Gold is moving sideways after a strong impulsive move up:
- A bullish break above (green arrow) the resistance (red) trend line could indicate an uptrend continuation. But if the current Elliott Wave analysis is correct, then the previous top should stop the uptrend.
- A bearish bounce (orange arrow) could complete the ABC (blue) in wave B (pink) and send price back down to the previous bottom.
- A bullish bounce (green arrow) at the previous bottom could complete the ABC (pink) pattern within wave 4 (yellow) and restart the uptrend.
- A deeper retracement below the previous bottom places the uptrend on hold or invalidates it.
Disclaimer: The content above represents only the views of the author or guest. It does not represent any views or positions of FOLLOWME and does not mean that FOLLOWME agrees with its statement or description, nor does it constitute any investment advice. For all actions taken by visitors based on information provided by the FOLLOWME community, the community does not assume any form of liability unless otherwise expressly promised in writing.
FOLLOWME Trading Community Website: https://www.followme.com


Hot
-THE END-