Trading Data Analysis provides readers with an in-depth analysis of FOLLOWME's trading ecosystem through a clear framework, comprehensive data, and visual charts.
This chapter describes the portraits of investors, ranging from age, region to academic background, from investment product preference to popular trading hours. Meticulous and detailed data can help users achieve accurate self-positioning, and at the same time empower brokers and practitioners to better conduct crowd insights and data analysis.
Group analysis of subscribers and signal providers helps users clearly understand how two different groups play their own roles in trading. Cryptocurrency trading analysis reveals to industry users that in the current wave, only industry norms and self-discipline can achieve long-term development.
Investor Portrait
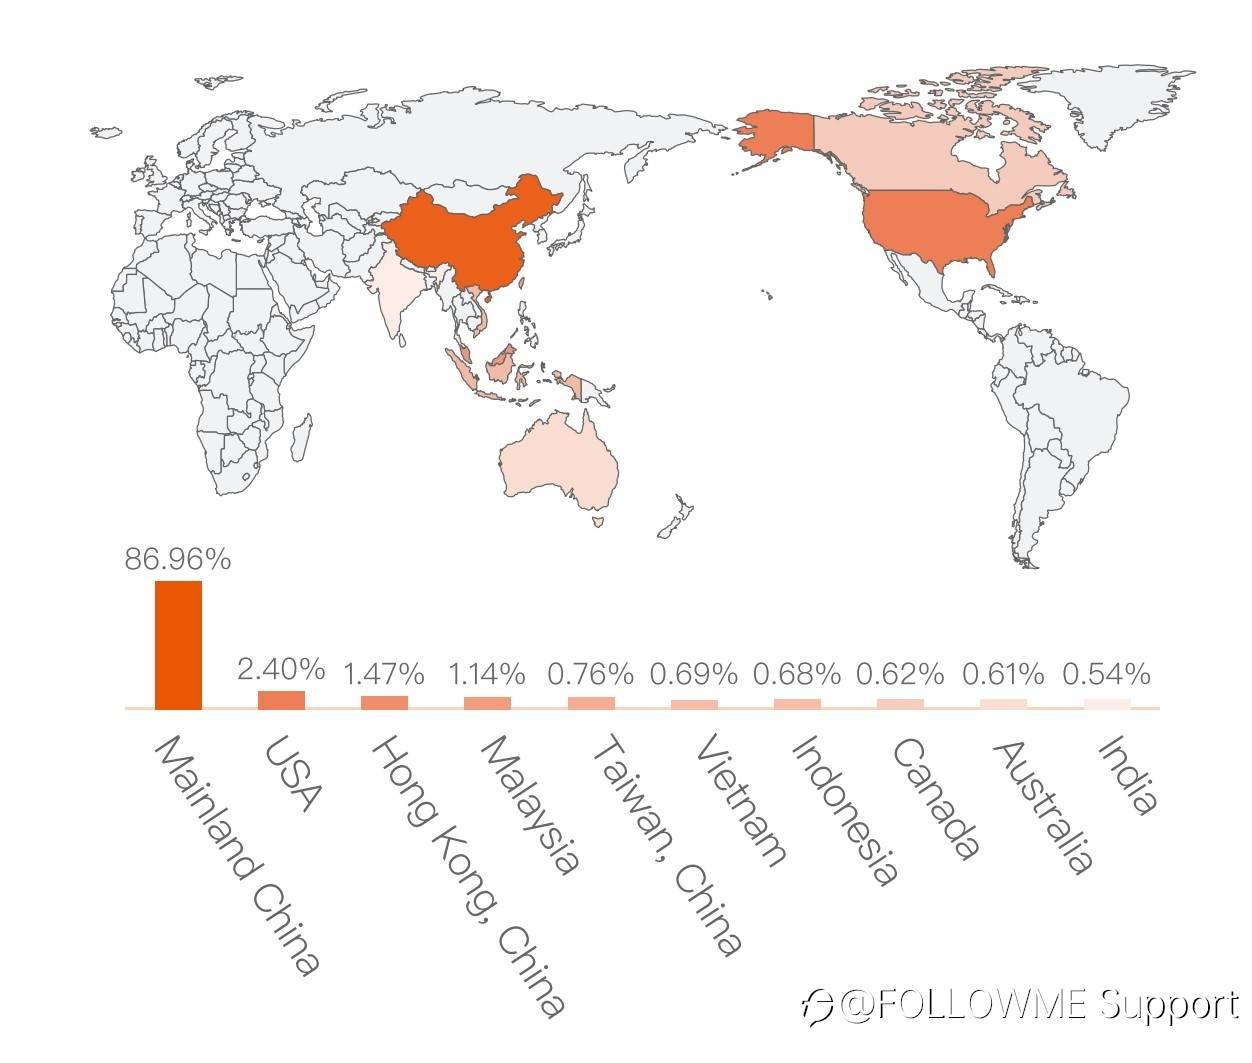
1. Geographical Distribution
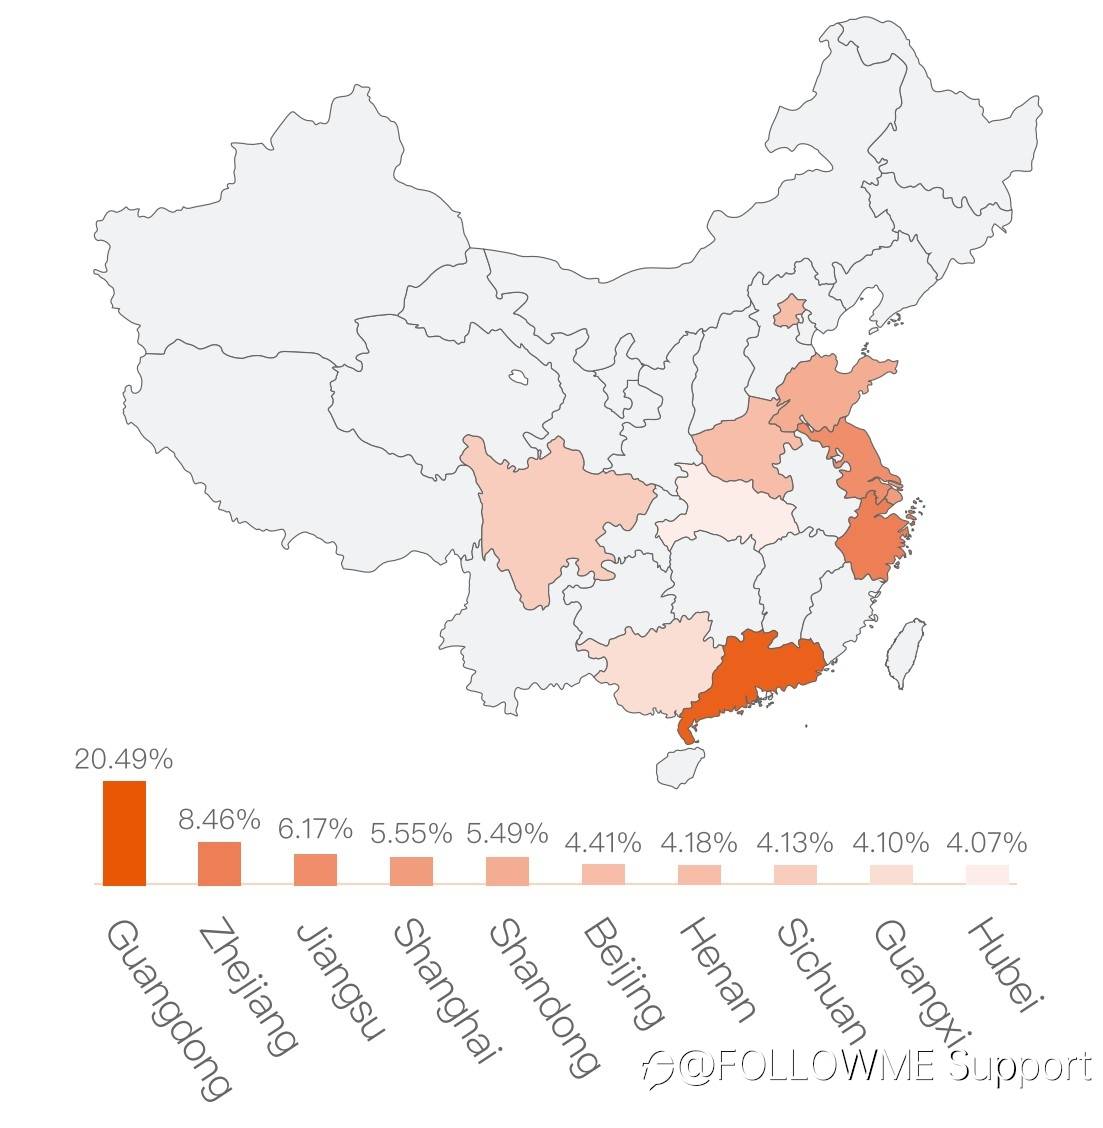
In the first half of 2021, investors who connected live accounts on FOLLOWME came from 170 countries on five continents. The number of investors in mainland China accounted for 86.96%, far exceeding the rest of the world. Among them, Guangdong Province of China leads other provinces in mainland China with 20.49% of investors.
2. Age and Education Level
Young people (referred to in this report as those aged 34 and below) have become the key player of Forex investment. The main reasons are the following.
- The changing of ideas. More young people realize that investment may become a way to seek wealth apart from working;
- The education level of young people has generally improved. In fact, the bachelor degree and above accounted for the highest proportion of people engaged in Forex trading;
- The income of young people has generally increased.
Investors between the ages of 18-44 are the majority of players in FOLLOWME's trading.

3. Gender Differences
Profit account
In the first half of the year, female trading accounts accounted for 16% of all trading accounts. In addition, female profitable accounts accounted for 2.5% more than males.
Profit and loss amount
The average loss of male accounts is $173 less than that of females.
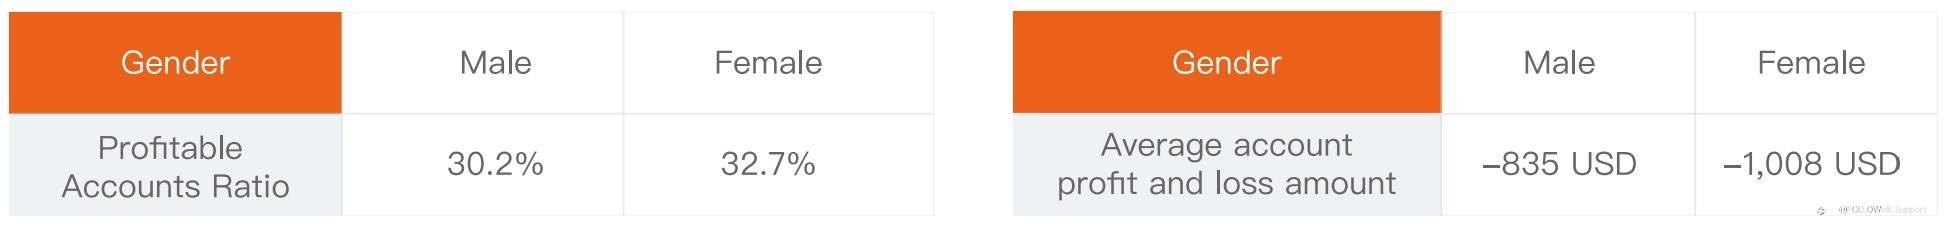
Note: In order to reflect the credibility among the investor group, accounts with a profit or loss of more than 50,000 USD are not counted (accounting for 1.32%)
4. Popular Trading Symbols
FOLLOWME top ten major trading symbols are XAU/USD, EUR/USD, GBP/USD, USD/JPY, AUD/USD, USD/CAD, GBP/JPY, WTI, USD/CHF, BTC/USD.
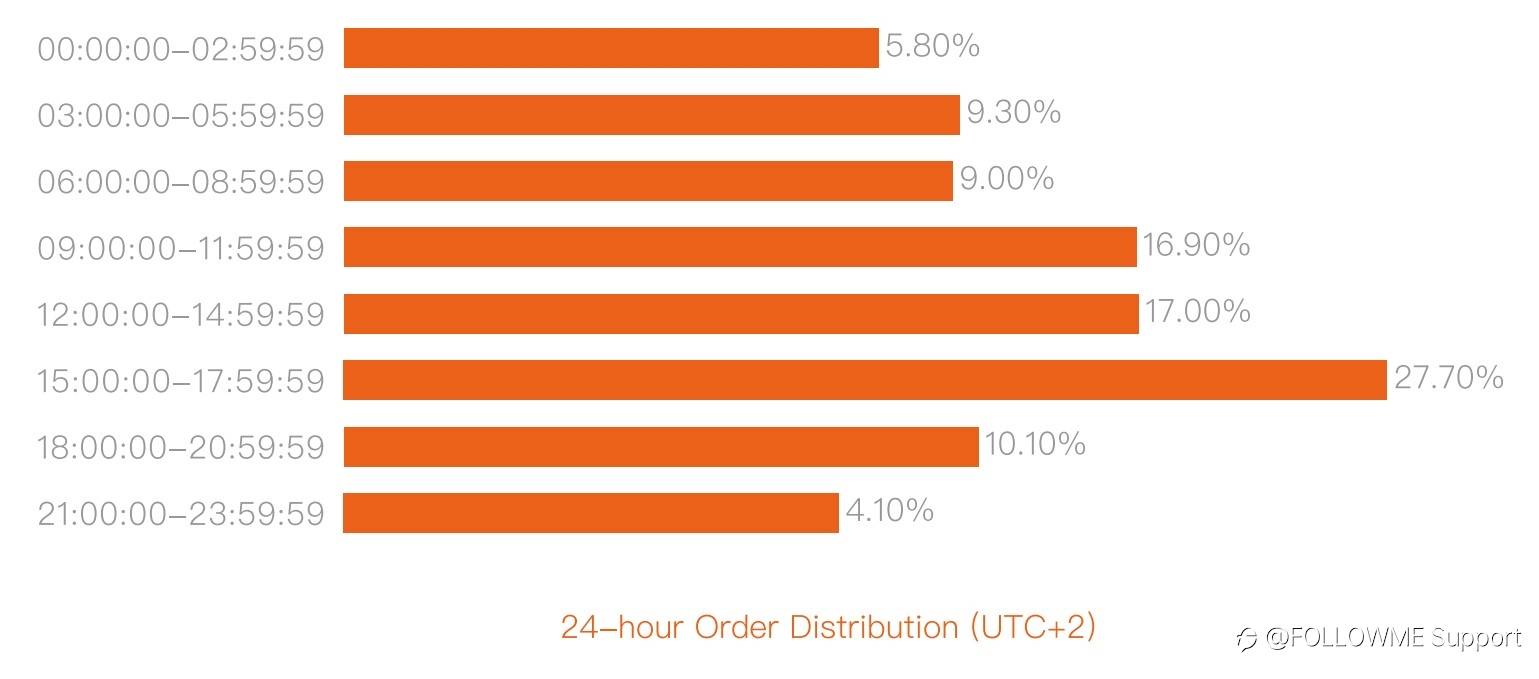
5. Hot Trading Hours
Forex market opening hours :
Asian session: 02:00—10:00 (UTC+2, Same below)
European session: 09:00-17:00
US session: 15:00—22:00
(In wintertime, it will be delayed by one hour.)
The time period with the largest number of participants and trade orders is 15:00 - 17:00, which has an important relationship with the opening of US stocks.
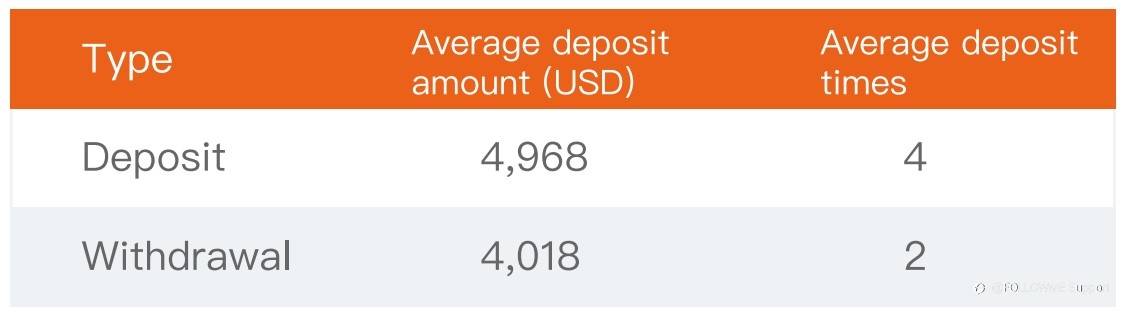
6. Average Deposit
Overall deposit situation

Deposits in different regions
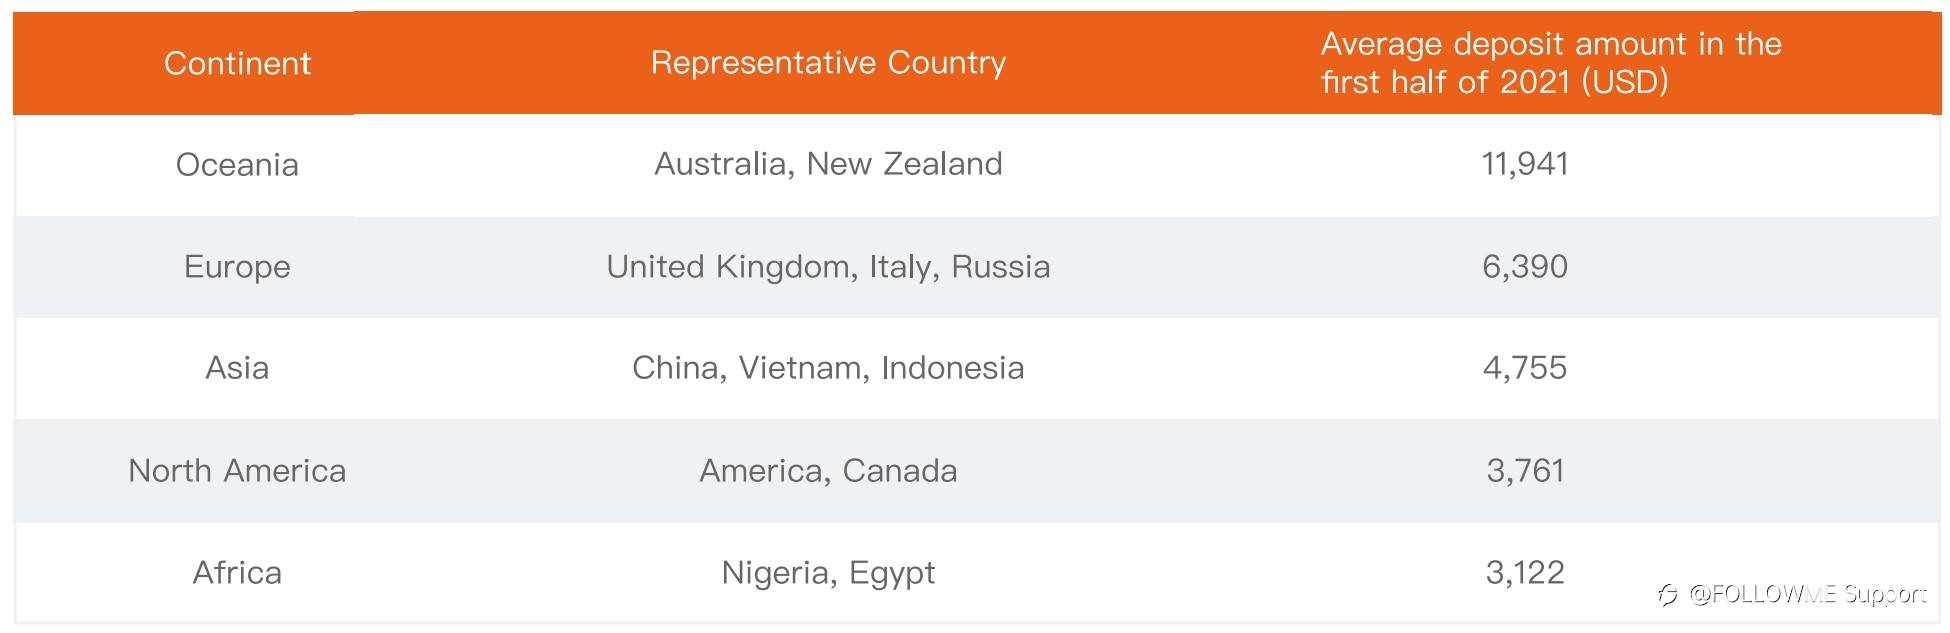
It is worth mentioning that the average deposit in China is 4,862 USD, slightly higher than the average in Asia, the average deposit in Southeast Asia is 3,878 USD, and the average deposit in the rest of Asia is 3,047 USD.
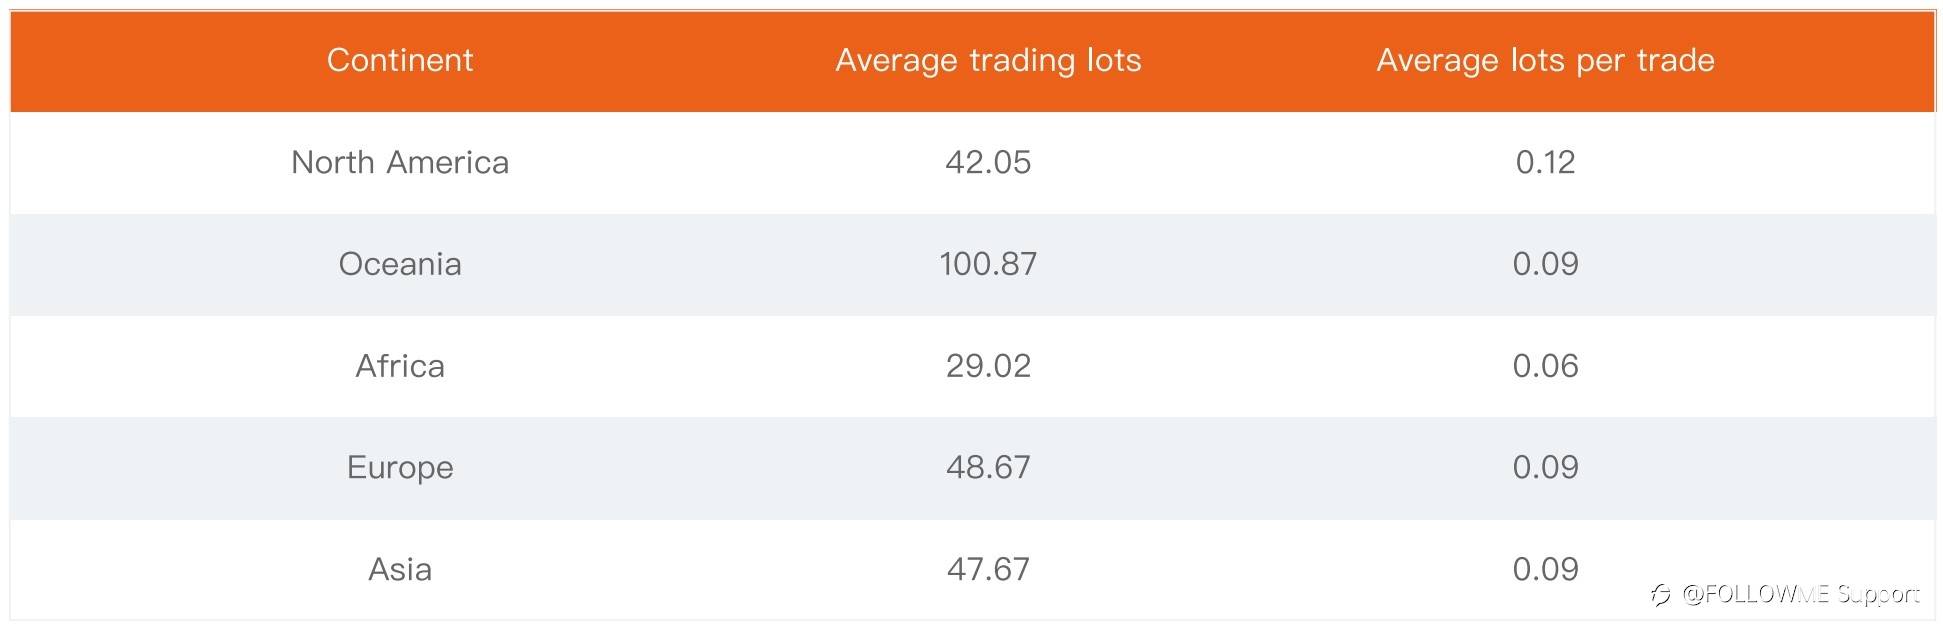
7. Average Number of Trades
Overall trading situation
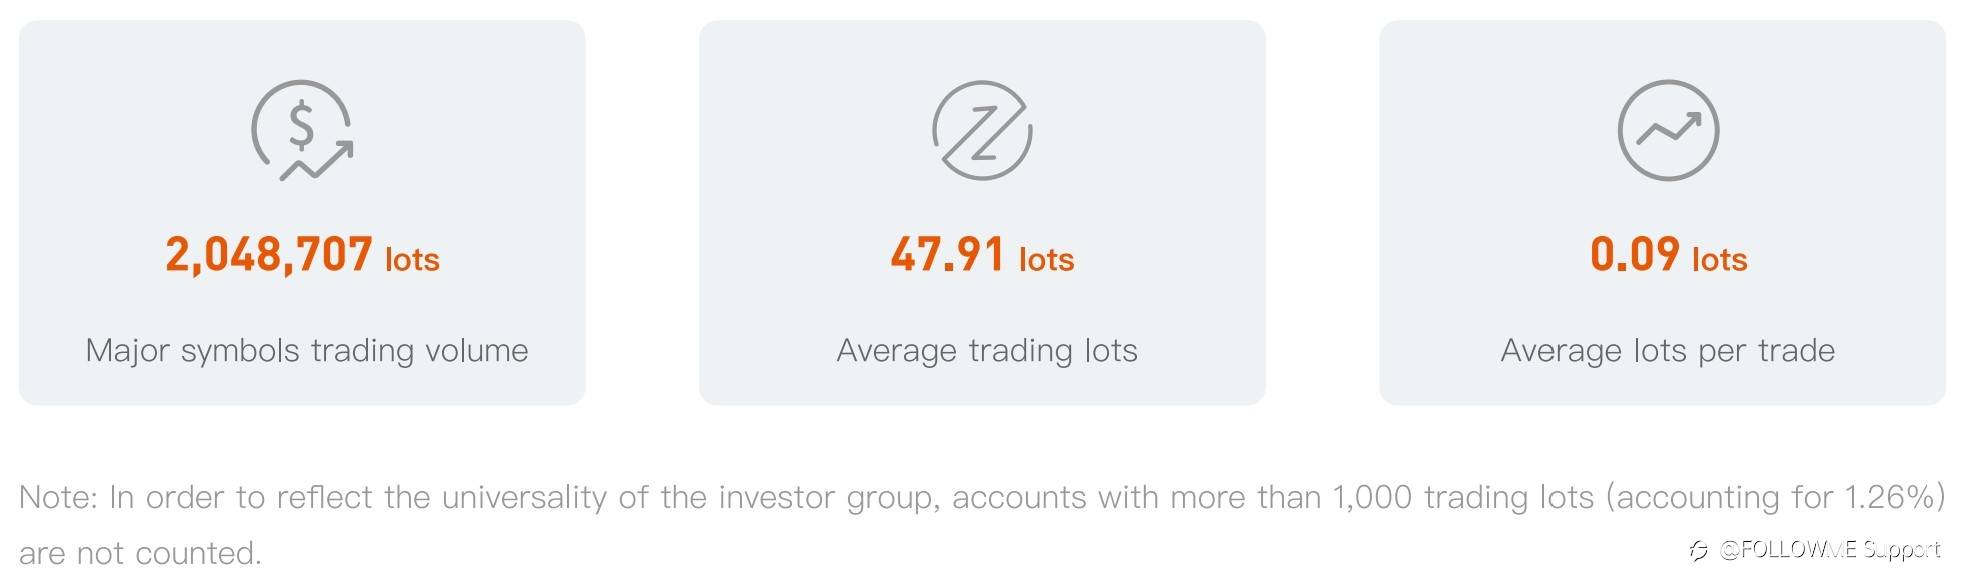
Average trading volume in different regions
In terms of regional distribution, Investors in North America, Europe, and Asia are close to each other in terms of trading volume in major symbols, while investors in Oceania are far ahead.
Overall Trading Data
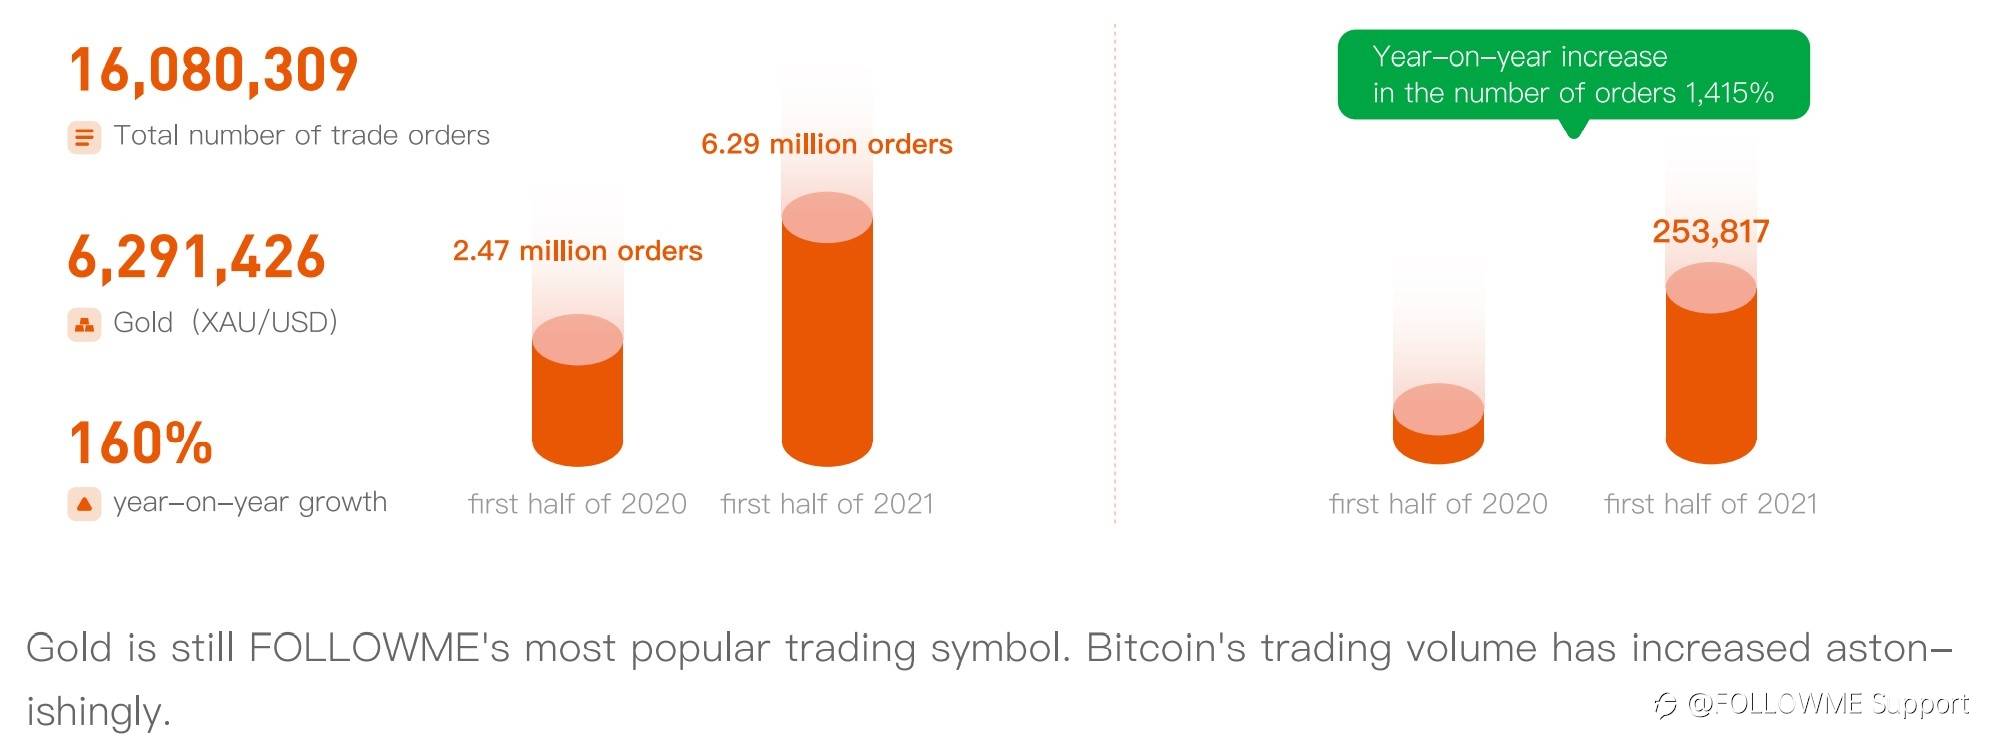
In the first half of 2021, there were a total of 16,080,309 trading orders made on FOLLOWME, with an average daily trades of 127,622, that is, one new order was made every 0.68 seconds. Among them, there were 2,411,487 copytrade orders, and the number of copytrade orders increased by 167.9% year on year.

(The number of orders increased by 93.7% year-on-year, and the number of copy trade orders increased by 167.9% year-on-year)
Data collecting time: 2021-01-01 to 2021-06-25
Order statistics range: closed orders of live accounts within the statistical time
Trading days in the first half of the year: A total of 126 trading days, of which 4 trading days were closed due to US holidays, available trading days were 122 days.
1. Leverage distribution
What preferences do FOLLOWME investors have in choosing leverage in the first half of 2021? Do investors in different regions have anything in common when choosing leverage?
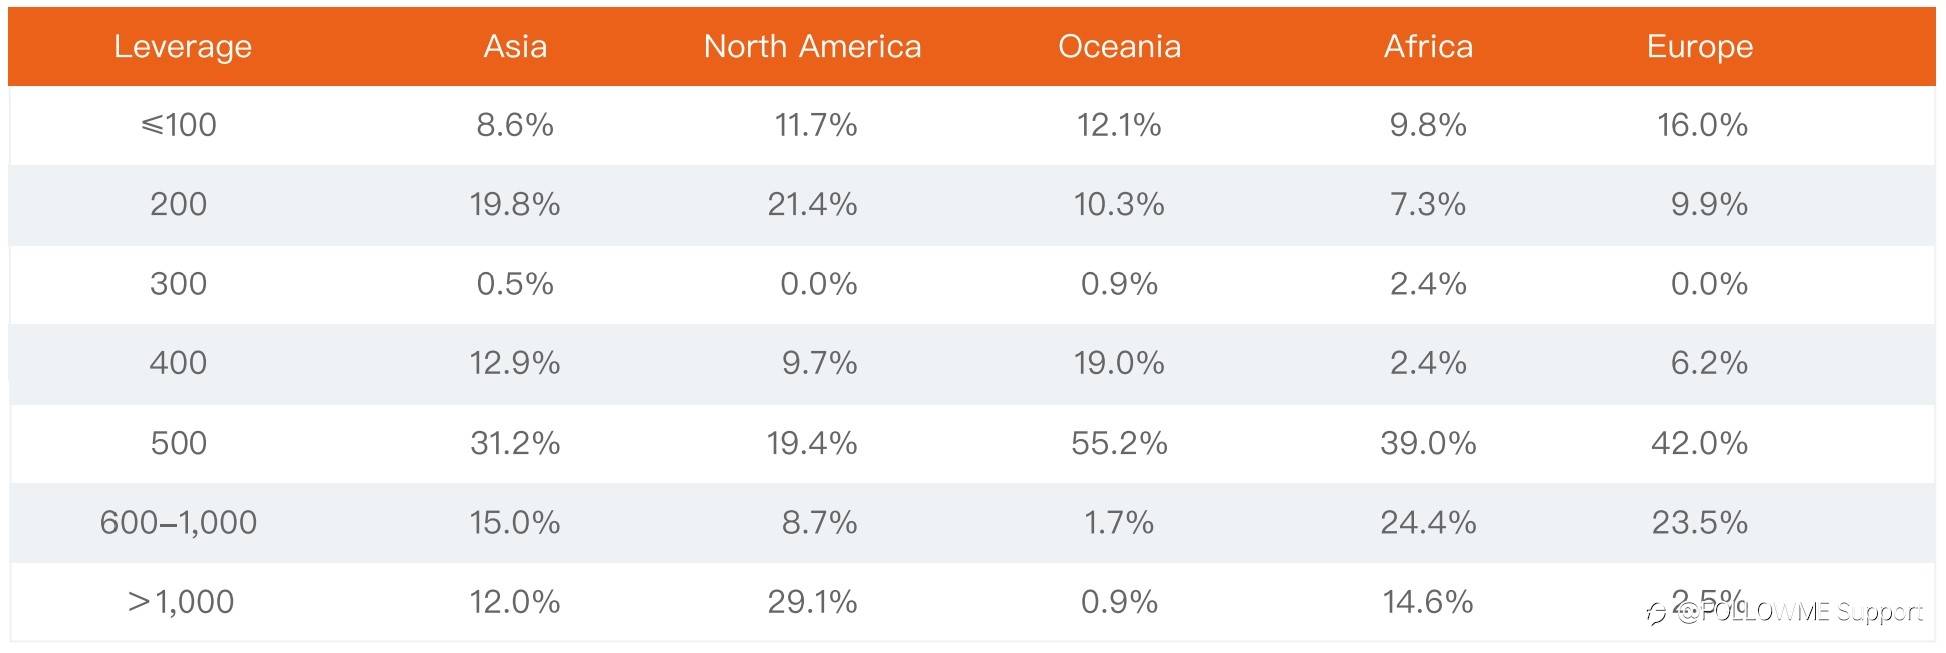
As can be seen from the above table, investors in Asia, Oceania, Africa, and Europe mainly choose 500 times leverage for trading, while North American investors represented by the United States mainly choose 1,000 times or more leverage for trading.
It should be noted that, from Asia’s perspective, Chinese investors mainly choose leverage of 500 times, while investors in Southeast Asia prefer 600-1,000 times of leverage.
2. Analysis of deposit & withdrawal and profit account
The amount of deposits can reflect the investor's financial strength. Combining the profit and loss data of the account, we can find that the account performance is different for different deposit amount ranges.
Description:
1. Take the amount of a single deposit or withdrawal ≥ $50 as the statistical range;
2. Note: To reflect the generality of the investor group, accounts with deposits and withdrawals exceeding $50,000 (3.3%) will not be counted.
In the first half of 2021, deposit accounts accounted for 74.7% of active accounts; withdrawal accounts accounted for 52% of active accounts.

It can be found that the number of accounts with deposit amounts between 50-500 US dollars is the largest, but the profitable accounts ratio is the lowest, only 22%;
Accounts with a deposit amount> 50,000 US dollars accounted for the lowest proportion. Only 3.2% of the accounts reached this scale, but the profitable accounts ratio was the highest, reaching 36.3%.
Conclusion: More deposits will make investors more serious and pay more attention to trading, and there will be more capital buffer space to facilitate risk management, thereby increasing the possibility of profitability.
3. Trading data of the 10 most popular symbols
FOLLOWME is configured with more than 350 standard symbols including precious metals, energy, foreign exchange currency pairs, indices, cryptocurrencies, and commodities, and supports copy trading of these symbols.
In the first half of this year, investors traded 198 different kinds of products, including US stocks, Hong Kong stocks, European stocks, and other less popular products. However, in terms of the number of orders, 81.8% were in the top 10 symbols.
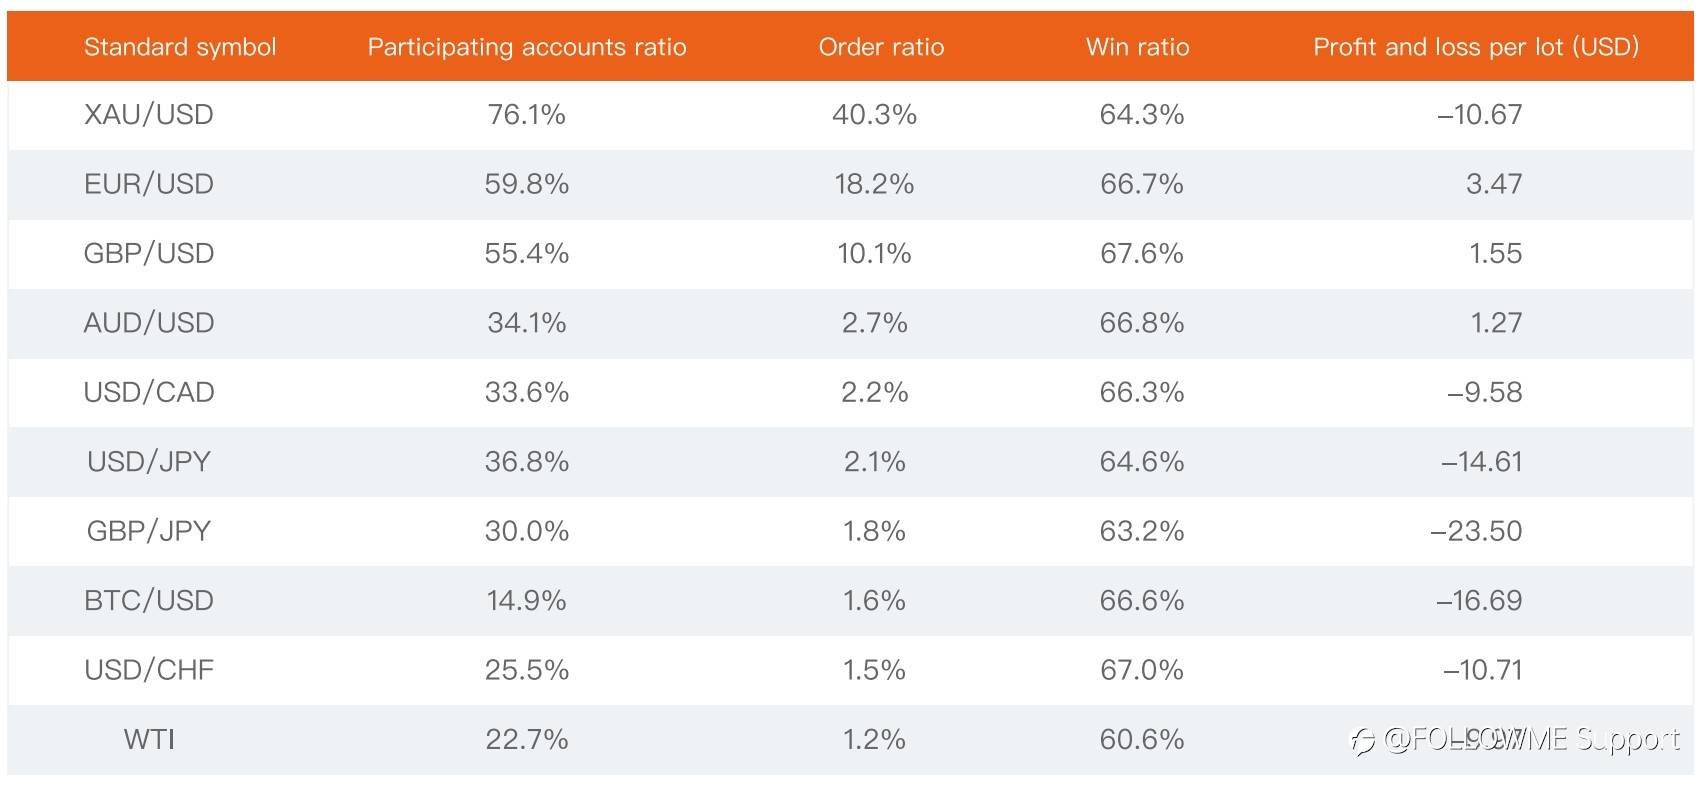
In the first half of 2021, FOLLOWME's most popular symbol is still XAU/USD. 76% of accounts participated in gold trading, and gold orders account for 40% of all orders.
Although the winning rate (number of profitable orders/number of total orders) of the 10 symbols is over 60%, it can be seen from the profit and loss of each lot that in the trading of these symbols in the first half of this year, the investors only gained a small amount of profits on the three varieties EUR/USD, GBP/USD and AUD/USD, while the other symbols lost money.
BTC/USD ranked the top 10 symbols for the first time, ranking 8 place, which popularity is obvious.

In the first half of the year's trading, investors conducted more unilateral transactions in AUD/USD, USD/CAD, GBP/JPY, USD/CHF, WTI US crude oil, etc., while the remaining symbols maintained a long-short trading balance.
Here comes another question. Accounts that focus on trading in a few symbols and accounts that trade multiple symbols in a diversified manner, which one has a higher profit probability?

From the data of profitable accounts ratio, it can be seen that accounts that focus on trading a few symbols are more likely to be profitable.
4. Overnight fee and handling fee
In Forex trading, if you need to hold a position overnight, the broker will charge you an overnight fee. For long-term investors, the overnight fee is quite a cost. In addition, some account types will also charge a handling fee when trading.
Let's take a look at the overnight fee and handling fee expenditures in the first half of 2021.
Accounts that paid overnight fees account for 80.4% of the total accounts, the accounts that earned overnight fees account for 2.7% of all accounts; Accounts that pay handling fees account for 40.5% of all accounts, the accounts without overnight fees, and handling fees accounted for 12.6%.
Percentage of overnight fees = sum of overnight fees/sum of trading profits and losses
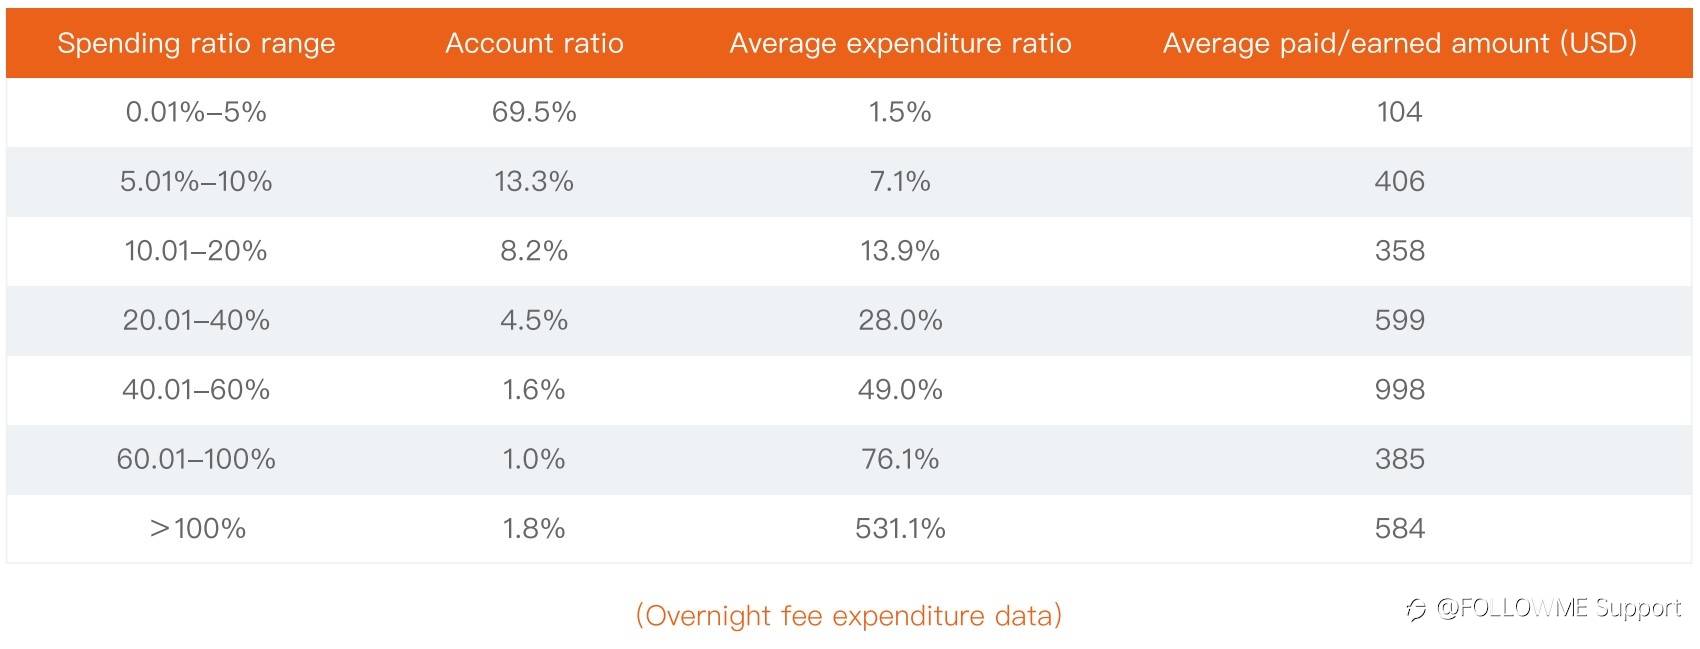
Excluding the accounts where the overnight expense accounted for more than 100% of average closed equity, the average overnight expense accounted for 6.1%, which was 207 USD; For accounts with overnight fee income, the average overnight fee income accounted for 2.4%, which was 71 USD.
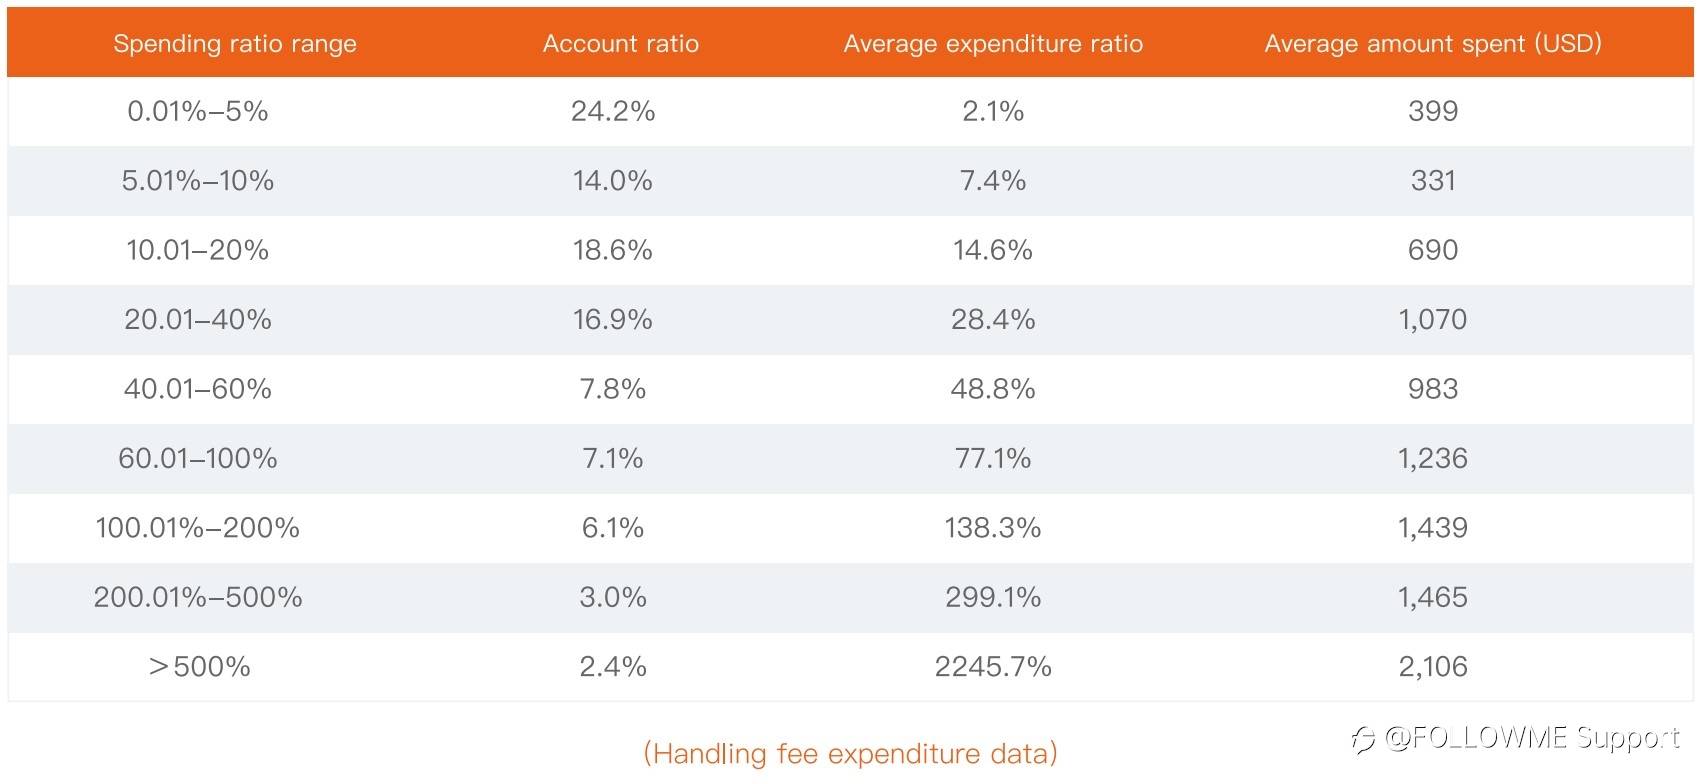
Excluding the accounts where the overnight expense accounted for more than 500% of average closed equity, the average handling fee accounted for 36.6%, which was 767 USD. In trading costs, in addition to the cost of spreads, a reasonable reduction in overnight fees and handling fees is what investors need to improve when trading.
5. Top 10 Profits and top 10 losses
FOLLOWME combines six dimensions to comprehensively score investor accounts, one of which is the "Casual Profit" score. Calculate and measure the stability of trading signals based on the sum of the profit of the top 10 orders with the highest profit on the account, and the ratio of the sum of all profitable orders in the account, the lower the ratio, the more stable the signal.
Let's take a look at the performance of investors in terms of trading stability.
Description:
1. Exclude accounts with less than 100 orders;
2. Exclude the top 10 profits and the top 10 losses orders, and the accounts with profits and losses within 10 USD;
3. Profit ratio of the top 10 orders= Profit amount of the top 10 orders/total profit amount;
4. Lose ratio of the top 10 orders= Loss amount of the top 10 orders/total loss amount;
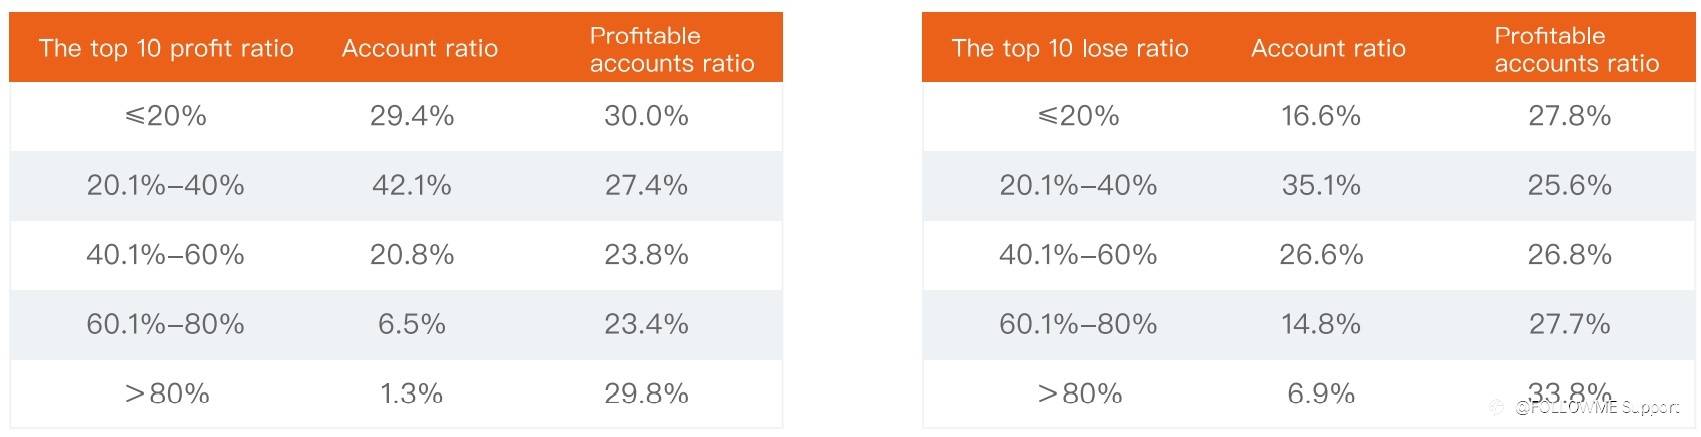
For more than 70% of investors, the top 10 profitable orders accounted for less than 40%, excluding the extreme value (1.3% of the top 10 profit ratio range> 80%), this part of investors also has the highest proportion of profitable accounts. In contrast, investors with the top 10 losses accounting for more than 80% are the group with the highest proportion of profitable accounts.
6. Margin call
In the first half of 2021, more than 228,704 orders were forced to close positions due to insufficient margin, namely “margin call”. Among them, 5% of the orders are profitable and 95% of the orders are loss-making.

From the distribution of the symbols of margin call orders, nearly half of the orders are gold trades. In addition, 2/3 of the breakout accounts have met margin call in gold.
Data of imTrader Trading Competition Season 8
The imTrader trading competition welcomes global traders. It sticks to the concept of "discovering outstanding traders and broadcasting good trading strategies", adhering to the principles of openness, fairness, and justice, and aims to discover outstanding traders who can achieve stable profits. It also provides a stage for contestants to demonstrate their trading capabilities.
The imTrader trading competition has established a real trading system that can identify trading capabilities. It uses a unified trading account as the judging standard and adopts a comprehensive ranking standard so that advanced traders can stand out through the system. The competition is not only a competitive platform, a display platform but also a communication platform for the traders.
The contest supports the connection of MT4 real trading accounts of more than 3,000 brokers around the world. Traders can participate as long as they have an MT4 account.
The imTrader trading competition S8 attracted a total of 4,836 accounts from 177 brokers. After three months of fierce competition, many excellent trading accounts have shown their skills, contributing a hearty trading feast for FOLLOWME users!
Contest data are as follows:

In season 8, there were 4,836 participating accounts with a total capital of 38,577,737 US dollars, of which 73 participating accounts exceeded 100,000 US dollars and 130 participating accounts exceeded 50,000 US dollars.
A total of 1,491,441 orders were made in this competition, of which 1,206 accounts were profitable from closed positions, accounting for 24.9%.
Among the 4,836 participating accounts that closed position, 1,206 accounts were profitable, accounting for 24.9%.
Account equity grouping
A total of 4,353 accounts participated in the lightweight group, of which 1,007 accounts were profitable, accounting for 23.1%;
A total of 483 accounts participated in the heavyweight group, of which 199 accounts were profitable, accounting for 41.2%.
Account equity requirements: account equity must be greater than 0. The contest will be divided into the lightweight group (account equity <10,000 USD) and the heavyweight group (account equity ≥10,000 USD) according to the account equity at the time of registration.

Trading symbols
There are more than 400 varieties of account transactions in the S8 season, including precious metals, energy, foreign exchange currency pairs, indices, cryptocurrencies, stocks, and bonds. Regarding the number of orders, 44% of the orders are trading gold, and 83% of the participating accounts have taken gold as their trading symbol. It is worth noting that 15% of participating accounts participate in Bitcoin trading, and the number of Bitcoin orders has ranked fifth place in season 8's most popular trading variety.
In season 8, FOLLOWME and the Blue Ribbon Marine Conservation Association jointly contribute to marine public welfare. For every additional entry account, FOLLOWME will donate $1 to the Blue Ribbon Marine Conservation Association, so that every participant can contribute to the public welfare at his fingertips.
At present, the donation has reached 4,836 US dollars.
In the past four years, the imTrader trading competition has been successfully held for 8 seasons, with a total of 15,000 participating accounts and a cumulative participation fund exceeding 100 million US dollars. Along the way, FOLLOWME thanks all participating users, media, and partners for their support. We are committed to working with partners across the industry to continuously carry out in-depth exploration and resource integration, to deliver positivity to the industry, and to jointly create a professional and creditable event for users and the industry!
Investor Behavior Analysis
1. Low-frequency trading and high-frequency trading
Whether to maintain low-frequency trading and reduce the chance of making mistakes or to seize every opportunity to increase the utilization rate of funds, this topic has been heatedly discussed among investors for a long time, which has also raised a lot of discussion among FOLLOWME users. Let’s take a look at the account performance under different trading frequencies from the order data in the first half of the year.
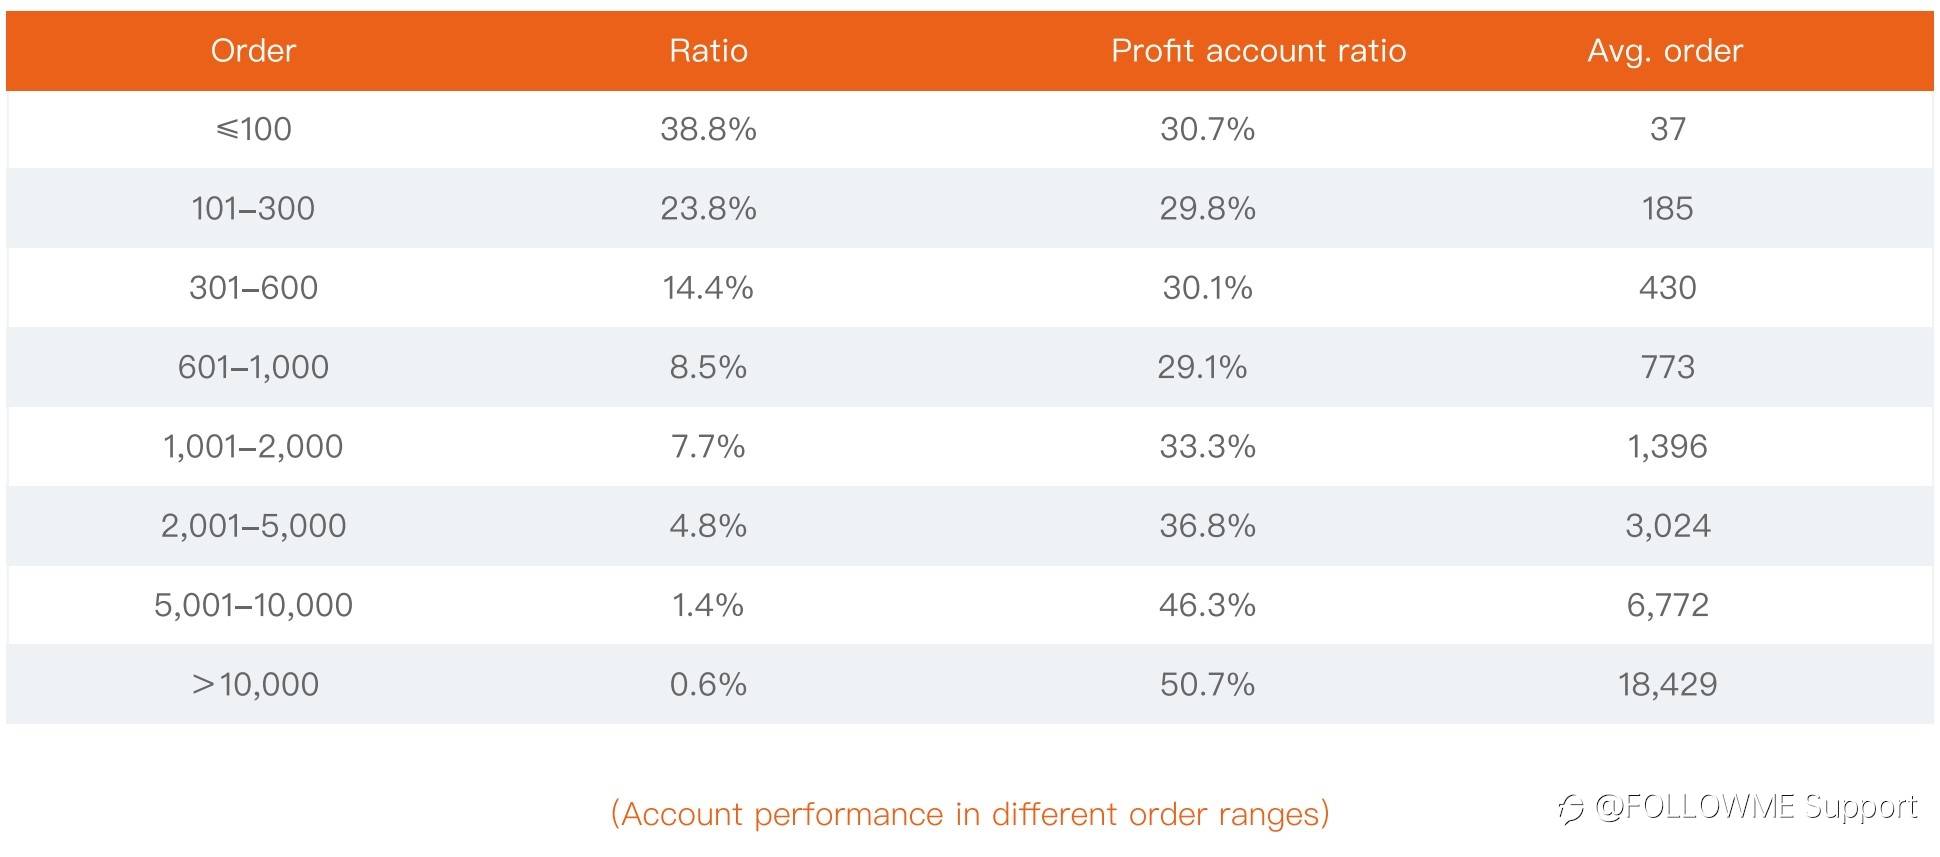
Divide the number of account trading orders into intervals, and count the number of profitable accounts in each interval. We calculated the distribution of profitable accounts under different trading frequencies. It can be seen that accounts with more than 1,000 orders are profitable accounts. The proportion is gradually increasing, and accounts with more than 10,000 orders account for 50.7% of profitable accounts.
Please look at the above data rationally. Compared with manual trading, EA quantitative trading will generate more orders and require higher professional knowledge.
We have also seen that the number of accounts with more than 5,000 orders only accounts for 2% of the total number of accounts. For more investors, the frequency of trading should be determined according to the trading strategy.
2. Difference between whether to set stop loss (take gold as an example)
In the foreign exchange margin trading market, emphasizing risk control cannot be overstated, and setting a stop loss on orders is an effective measure for most manual investors to control risks. So how well investors performed in stop-loss settings in the first half of the year? What difference did the order result make?
Statistics description:
a. In this section, we select the gold variety with the most trading volume as the order statistics object, and calculate the sum of the number of lost orders and the number of loss points for each account on the gold variety, and then count the sum of the number of lost orders and the number of lost points in the orders with a stop less in gold trading. Please note that the order that sets the stop loss ≠ the order that triggers the stop loss.
b. The number of loss-making orders for gold products was 2,419,879, of which 572,888 were placed for stop-loss orders, accounting for 23.7%.
c. In order to ensure the validity of the statistics as much as possible, we have eliminated the accounts with a loss of less than 30 orders.

Nearly half of the accounts have little or no stop loss for orders, a part of which is EA trading. The program contains stop loss settings, so there is no need to set stop loss prices in the order; the other part is the account’s weak awareness of risk or investor has not developed a stop loss habit.
Only 16% of the accounts set a stop loss for more than 80% of the orders, and these accounts have low points for a single loss. Less than 3% of the accounts insisted on setting a stop loss for each loss order during a long period of trading. Compared with the accounts that did not set a stop loss at all, the number of loss points per loss was reduced by 35%.
3. Analysis of winning rate and profit-loss ratio
Another hot topic, in long-term trading, is whether it is important to pursue a high win rate, a high profit-loss ratio, or a combination of both. Whether it is manual trading or subscribing to signals, winning rate and profit-loss ratio are important factors to decide the performance of an account. According to different trading strategies, some trading accounts tend to maintain a high winning rate, and some trading accounts tend to maintain a high profit-loss ratio, and each has its own trade-offs. Through the data, let's take a look at the performance of investors in terms of win rate and profit-loss ratio.
Win rate = number of profitable orders/number of all orders
Profit-loss ratio = average amount of profit per order / average amount of loss per order
If the profit-loss ratio is 1, it means that the average amount of each profit is the same as the average amount of each loss;
If the profit-loss ratio is 0.5, it means that the average amount of each loss is twice the average amount of each profit;
If the profit-loss ratio is 2, it means that the average amount of each profit is twice the average amount of each loss;
Signal order: the signal provider's trading order;
Copying order: the subscriber's copy trading order.
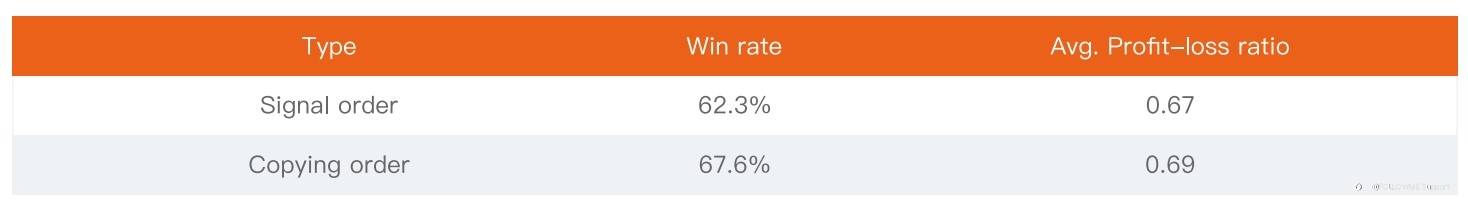
Counting the signal accounts and copying order accounts with more than 100 orders in the first half of the year, and calculating the order winning rate and the profit-loss ratio of each account, we can see that the subscriber account has a 5% higher winning rate than the signal account, and the profit-loss ratio is basically the same...
Next, let's take a look at the proportion of profitable accounts in different winning rate ranges.

As can be seen from the above table, 84% of investors can maintain a winning rate above 50%, and they are mainly in the 60%-80% range. It can be seen from the ratio of winning rate to the number of profitable accounts that the higher the winning rate, the higher the proportion of profitable accounts.
Let's take a look at the distribution of profit and loss ratio, as shown in the figure below:
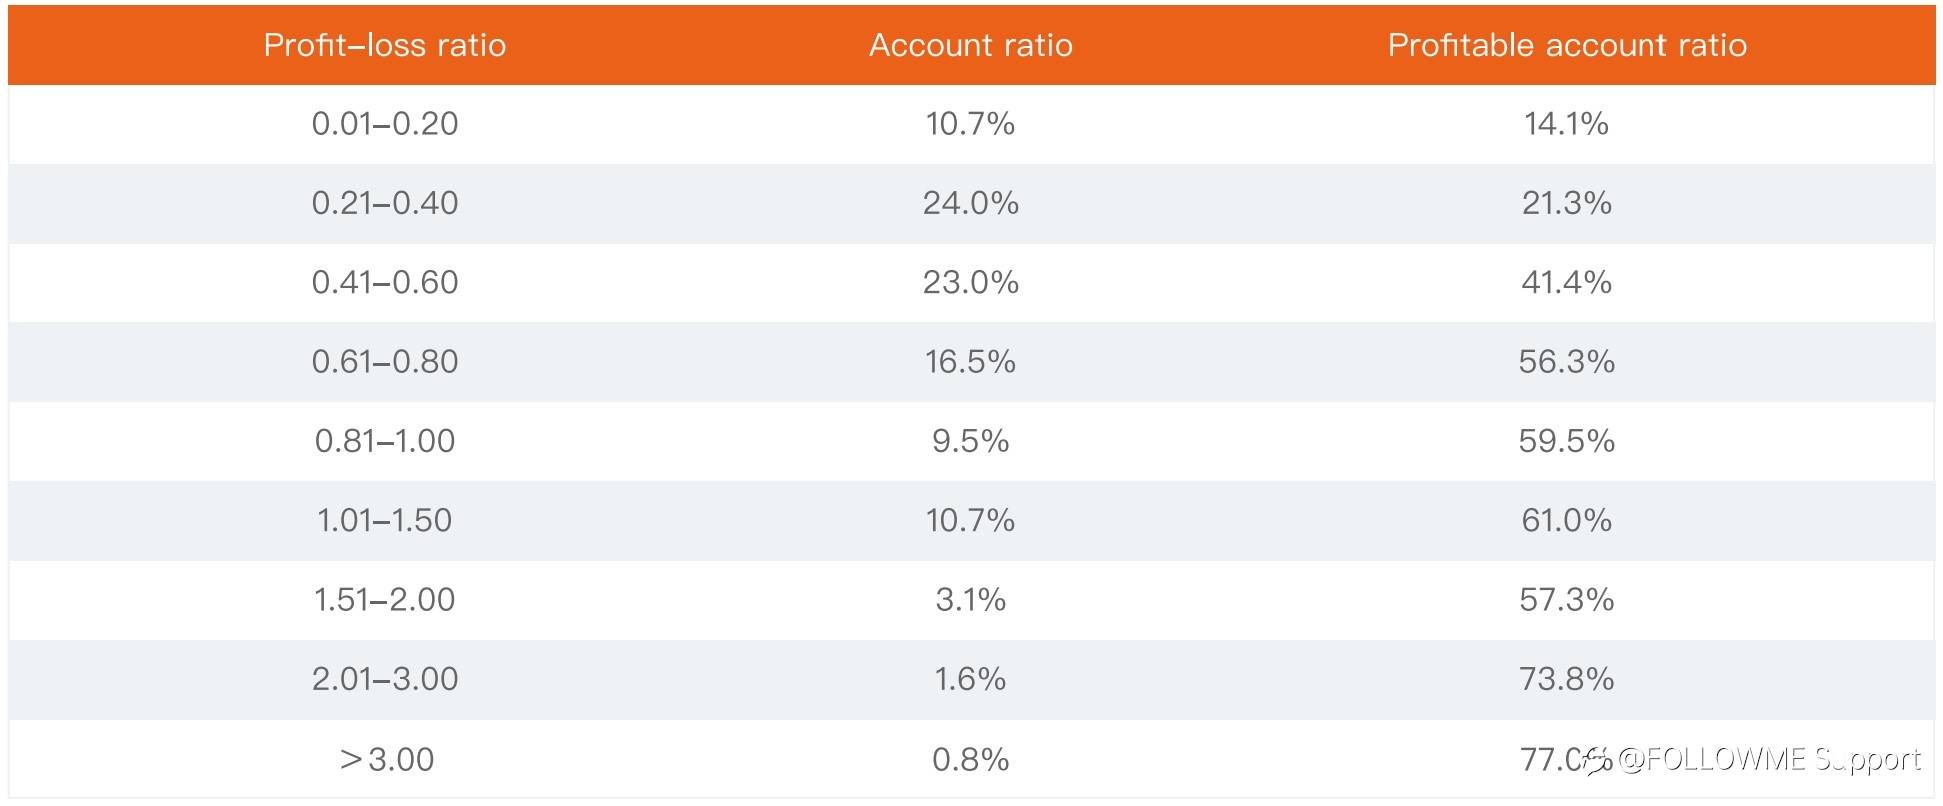
As can be seen from the above table, only 16% of the accounts can maintain a profit-loss ratio above 1, and the proportion of profitable accounts is generally positively correlated with the profit-loss ratio. The proportion of profitable accounts that maintain a profit-loss ratio above 2 accounted for as high as 74%.
Differentiate accounts with different profit-loss ratio ranges, find the average winning rate of each range account, and get a comparison table of profit-loss ratio and winning rate, as shown in the following figure:
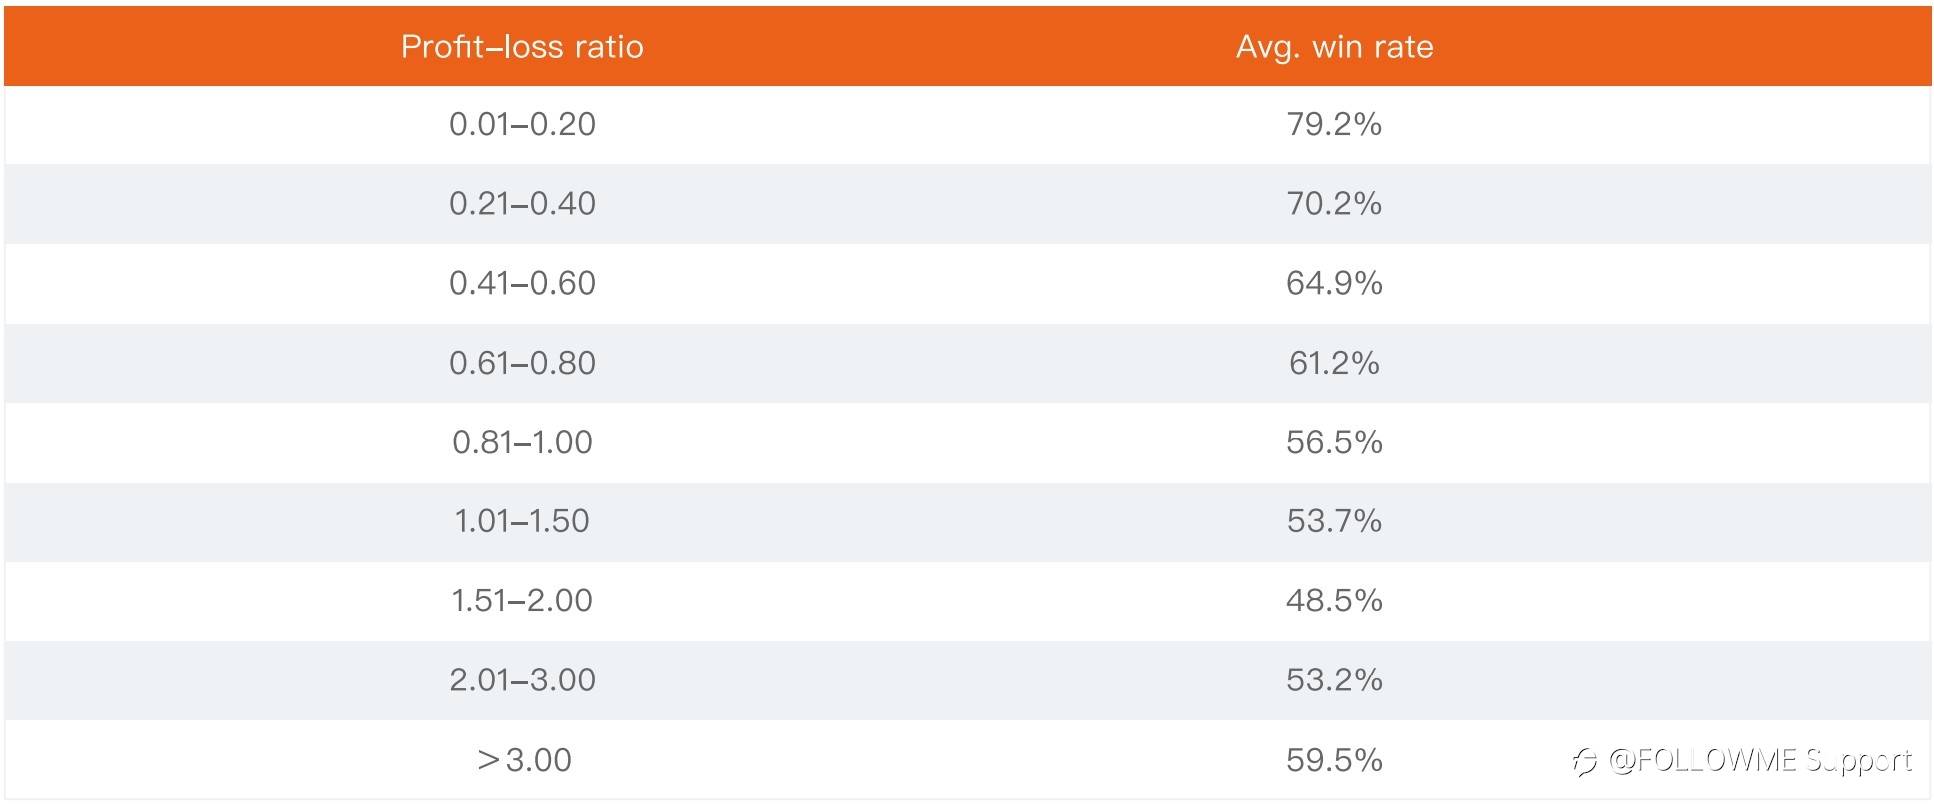
Through the above analysis of the account order winning rate and account profit-loss ratio, we understand that increasing the order winning rate can increase the profitability, and so as increasing the profit-loss ratio. Combining the data of profit-loss ratio and winning rate, we learn that the profit-loss ratio and the winning rate are negatively correlated, and the two are a trade-off relationship. Investors should find their own balance of profit-loss ratio and winning rate.
Filter out all profitable accounts with more than 100 orders, and average the profit-loss ratio and winning rate of these accounts to get an average profit-loss ratio of 0.88 and an average winning rate of 70%. This can be used as a reference.
Of course, there is a simpler calculation formula to help you analyze whether the profit-loss ratio and winning rate yourself are suitable. This is a calculation that is practical only when there are enough orders.
Example 1: Account A has currently traded 1,000 orders. It is known that the account has an average profit of 88 US dollars per order and an average loss of 100 US dollars per order. That is, the profit-loss ratio is 0.88, and the transaction winning rate is 70%. The result is calculated as follows:
100 orders * 0.7 winning rates * 88 average profit per order = total profit of 6,160 USD
100 orders * (1-0.7) winning rate * 100 average loss per order = total loss of 3,000 USD
6,160-3,000 = final profit of 3,160 USD
Example 2: Account B has currently traded 1,000 orders. It is known that the account has an average profit of US$100 per order, and an average loss of US$100 per order. That is, the profit-loss ratio is 1, the transaction winning rate is 60%, and the account has 100 orders per order. The result is calculated as follows:
100 orders * 0.6 winning rates * 100 average profit per order = total profit of 6,000 USD
100 orders * (1-0.6) winning rate * 100 average loss per order = total loss of 4,000 USD
6,000-4,000 = final profit of 2,000 USD
With the comparison of profit-loss ratio and winning rate, in the above two examples, we can know that account A (profit-loss ratio 0.88, winning rate 70%) performs better than account B (profit-loss ratio 1, winning rate 60%).
Copytrade Analysis
1. Order type
The number of accounts connected by FOLLOWME users continues to increase, with the total number of orders in the first half of 2021 will increase by 93.7%.
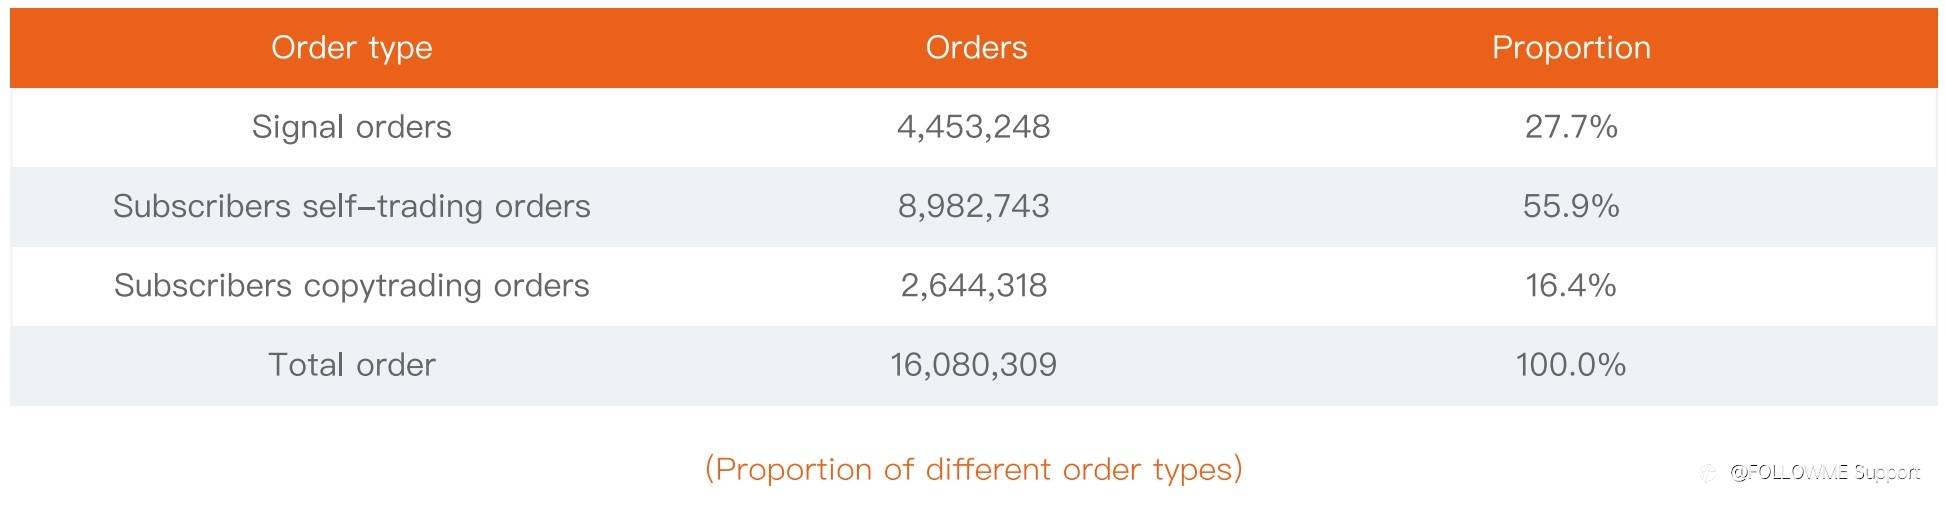
Signal provider orders accounted for 26.1% in the first half of 2020, and subscriber account orders accounted for 73.9%. In the first half of 2021, the overall proportion remained the same.
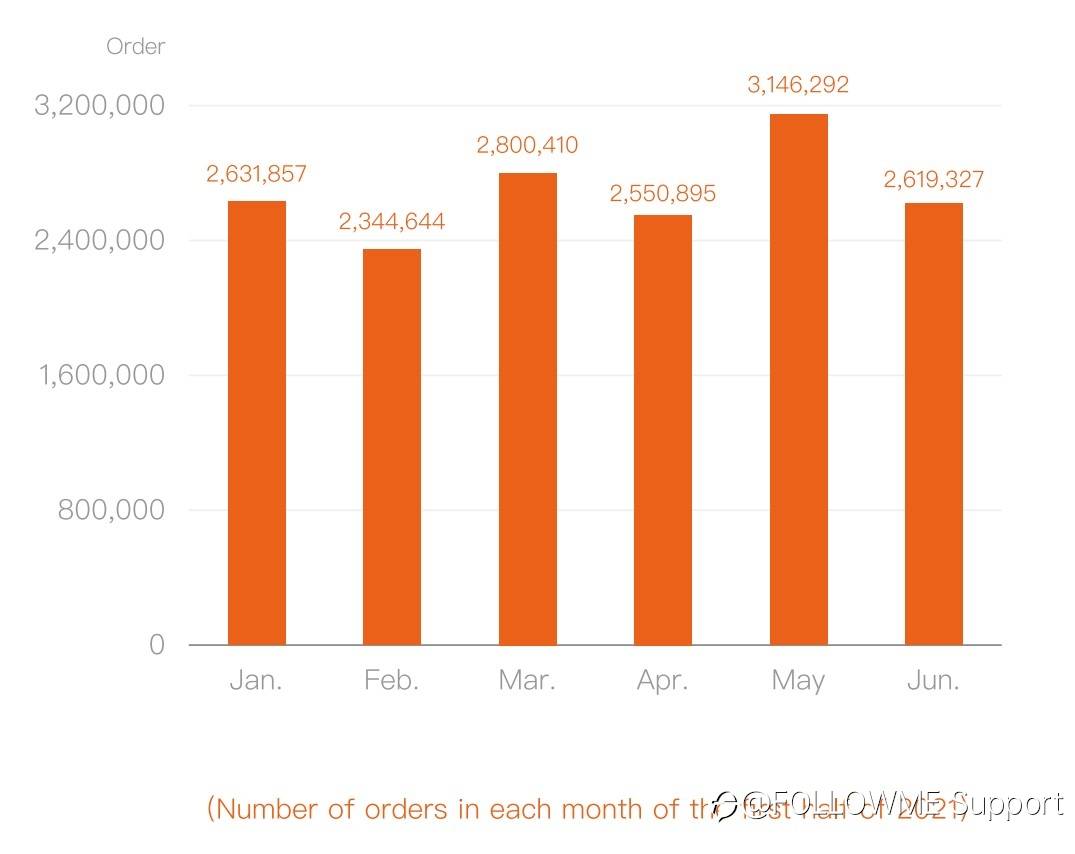
FOLLOWME's average monthly order number in the first half of 2021 is about 2.68 million, of which the scale of orders in May exceeded 3 million.
2. Signal provider
Nearly 5,000 signals from 199 brokers were added in the first half of the year.
A total of 161 brokers’ signals are subscribed, 22% of which are paid subscriptions, 78% are free subscriptions, and each signal is subscribed 27 times on average. The signal with the most subscriptions in the first half of the year came from broker FXTM. The signal was subscribed 9,319 times in the first half of the year, helping subscribers to earn 596,366 US dollars.
Performance of signals helping subscribers to profit
There are 16 signals that help subscribers to earn more than US$50,000, and on average, signals help subscribers to earn US$153,181.
There are 58 signals that help subscribers to earn more than US$10,000, and on average, signals help subscribers to earn US$22,135.
There are 37 signals that help subscribers to earn more than US$5,000, and on average, signals help subscribers to earn US$6,949.
3. Subscribers
In the first half of the year, subscribing accounts come from a total of 223 brokers. On average, each subscriber account made 5 subscriptions, and the maximum number of subscriptions reached 172 times. The performance of subscribing accounts in the first half of the year is as follows.
The account with the highest follow-up profit comes from trader XM, with a total profit of 97,857 US dollars.
83 subscribers follow earnings of more than US$10,000, with an average follow earnings of US$20,347;
90 subscribers follow earnings of more than US$5,000, with an average follow earnings of US$7,099;
467 subscribers had follow-up earnings of more than $1,000, with average follow-up earnings of US$2,262.
4. Copytrading analysis
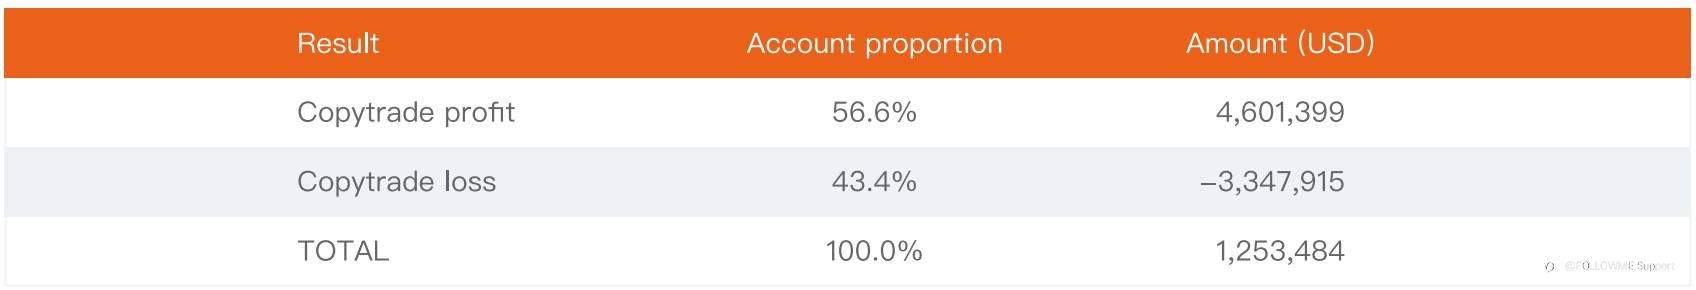
In the first half of 2021, the number of profiting copying accounts accounted for 56.6%, which was 13.2% higher than the proportion of loss-making accounts.
Cryptocurrency Trading Data
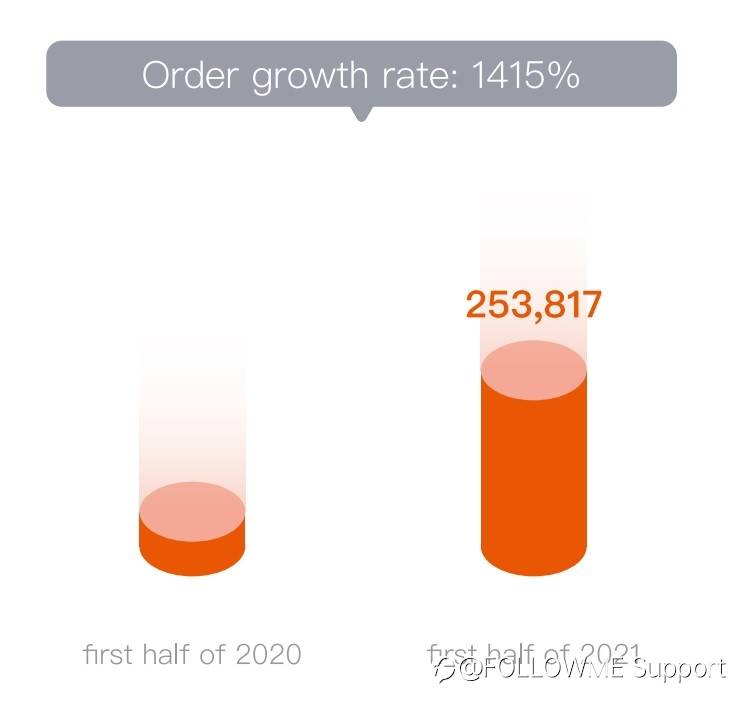
With the explosive development of cryptocurrencies, especially the unprecedented popularity of Bitcoin trading, we have found that more and more brokers are beginning to provide traders with products in a variety of cryptocurrencies, including Bitcoin, on MT4. Currently, there are 268 brokers on FOLLOWME that offer Bitcoin trading. In addition, in the first half of 2021, there were 130 brokers with accounts trading Bitcoin, with 253,817 trading orders, an increase of 1415% compared with the previous half-year, and an increase of 384% in the number of accounts.
Regarding Bitcoin, the accounts of 28 brokers performed COPYTRADE in the first half of 2021 and generated 30,000 copying orders.
Edited 19 Aug 2021, 17:38
Disclaimer: The views expressed are solely those of the author and do not represent the official position of Followme. Followme does not take responsibility for the accuracy, completeness, or reliability of the information provided and is not liable for any actions taken based on the content, unless explicitly stated in writing.

Leave Your Message Now