How to Trade Breakouts Using Trend Lines, Channels and Triangles

Just like breakouts on your face, the nice thing about breakout trading in forex is that opportunities are pretty easy to spot with the naked eye!
Unlike the former, you don’t even have to look in the mirror!

Once you start getting used to the signs of breakouts, you’ll be able to spot good potential trades fairly quickly.
Chart Patterns
By now you should be accustomed to looking at charts and recognizing familiar chart patterns that indicate a reversal breakout.
Here are just a few:
- Double Top/Bottom
- Head and Shoulders
- Triple Top/Bottom
For more information check out our lesson on chart patterns.
In addition to chart patterns, there are several tools and indicators you can use to supplement your case for a reversal breakout.
Trend Lines
The first way to spot a possible breakout is to draw trend lines on a chart.
To draw a trend line, you simply look at a chart and draw a line that goes with the current trend.
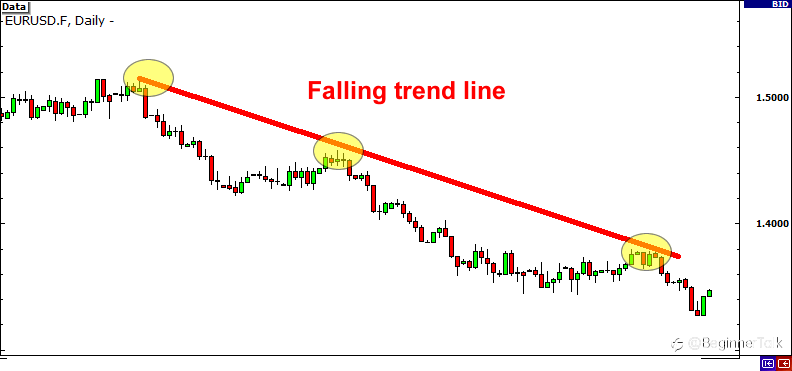
When drawing trend lines it is best if you can connect at least two tops or bottoms together. The more tops or bottoms that connect, the stronger the trend line.
So how can you use trend lines to your advantage? When the price approaches your trend line, only two things can happen.
- The price could bounce off the trend line and continue the trend.
- The price could break out through the trend line and cause a reversal.
We want to take advantage of that breakout!
Looking at the price is not enough, however. This is where using one or more of the indicators mentioned earlier in this lesson could help you tremendously
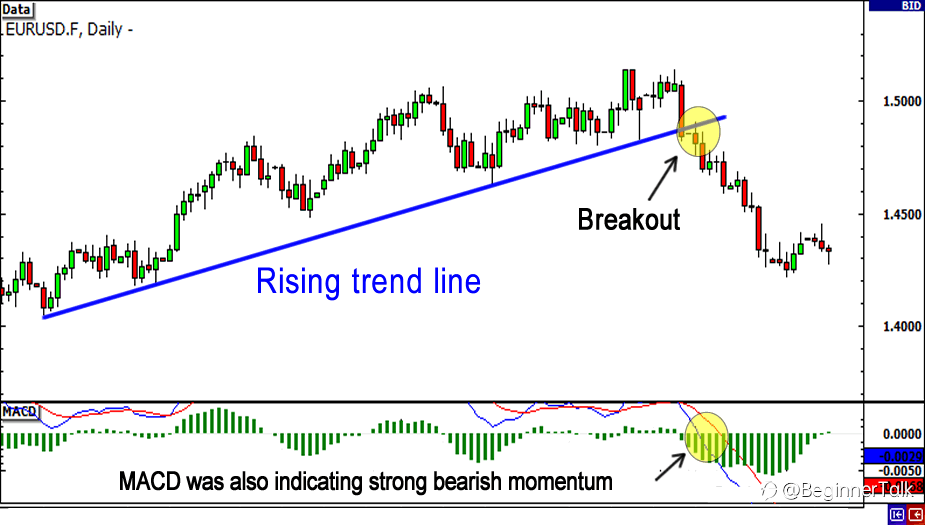
Notice that as EUR/USD broke the trend line MACD was showing bearish momentum.
Using this information we can safely say that the breakout will continue to push the euro down and as traders, we should short this pair.
Channels
Another way to spot breakout opportunities is to draw trend channels.
Drawing trend channels are almost the same as drawing trend lines except that after you draw a trend line you have to add the other side.
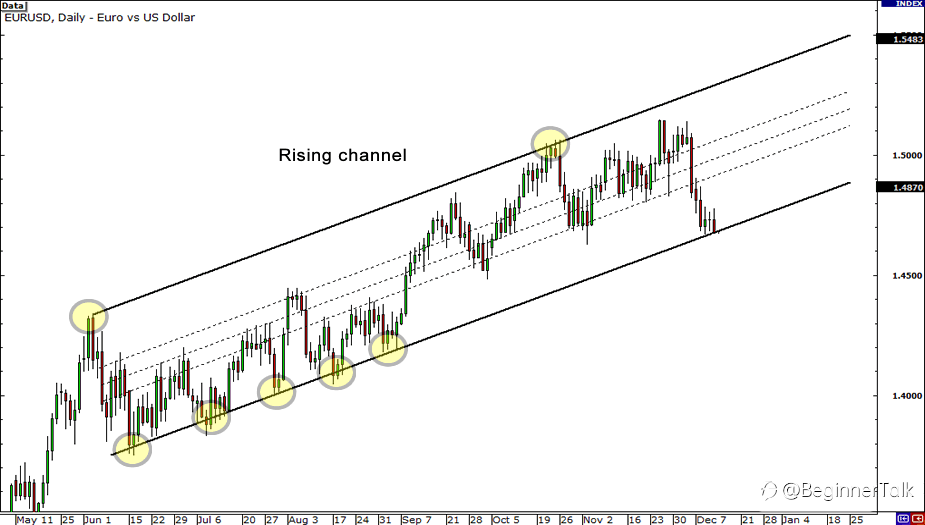
Channels are useful because you can spot breakouts in either direction of the trend.
The approach is similar to how we approach trend lines in that we wait for the price to reach one of the channel lines and look at the indicators to help us make our decision.
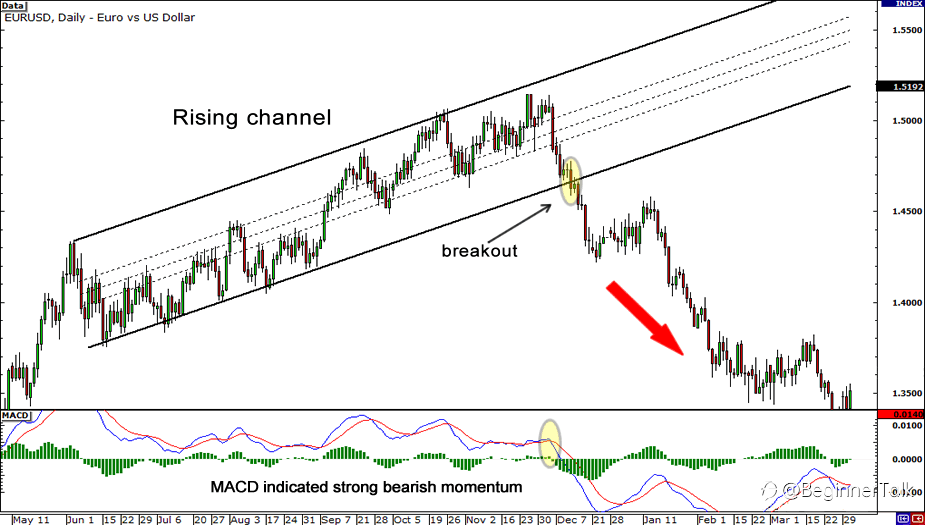
Notice that the MACD was showing strong bearish momentum as EUR/USD broke below the lower line of the trend channel. This would’ve been a good sign to go short!
Triangles
The third way you can spot breakout opportunities is by looking for triangles.
Triangles are formed when the market price starts off volatile and begins to consolidate into a tight range.
Our goal is to position ourselves when the market consolidates so that we can capture a move when a breakout occurs.
There are 3 types of triangles:
- Ascending triangle
- Descending triangle
- Symmetrical triangle
Ascending Triangles
Ascending triangles form when there is a resistance level and the market price continues to make higher lows.
This is a sign that the bulls are slowly starting to gain momentum over the bears.
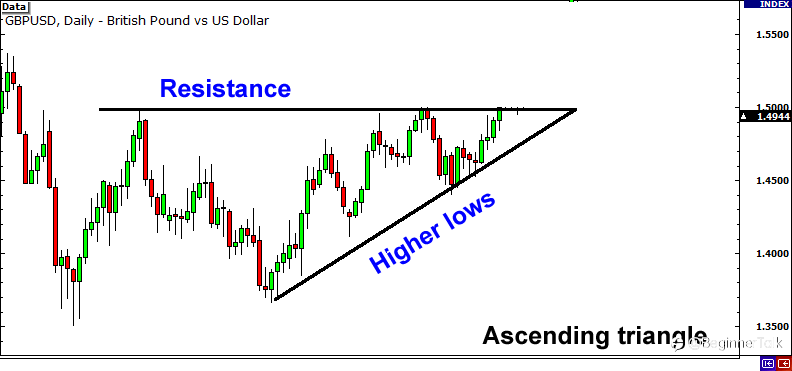
The story behind an ascending triangle is that each time the price reaches a certain high, there are several traders who are convinced about selling at that level, resulting in the price dropping back down.
On the other side, there are several traders who believe the price should be higher, and as the price begins to drop, buy higher than its previous low.
The result is a struggle between the bulls and bears which ultimately converges into an ultimate showdown…

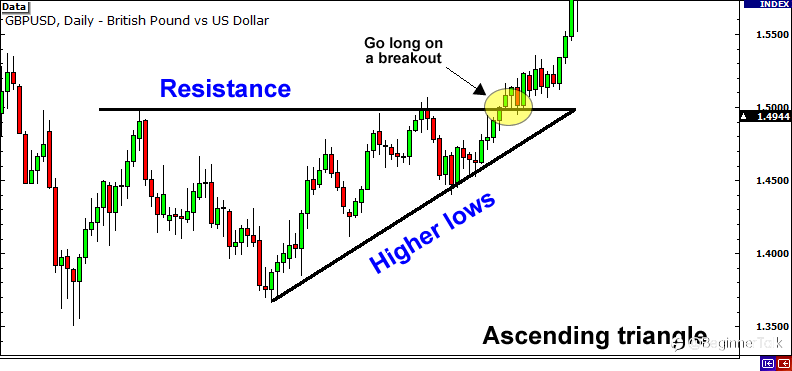
What we are looking for is a breakout to the upside since ascending triangles are generally bullish signals. When we see a breach of the resistance level the proper decision would be to go long.
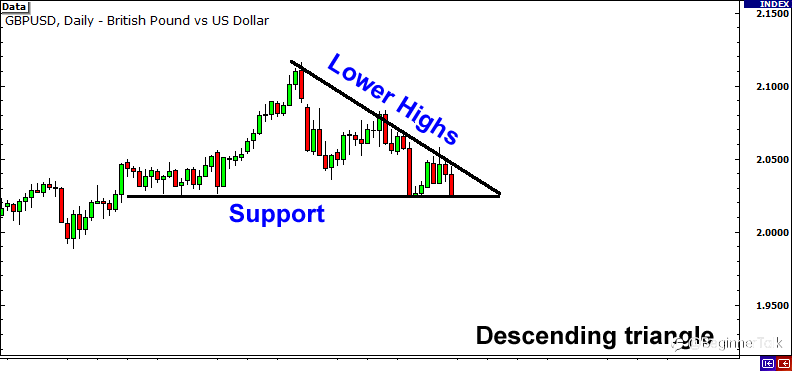
Descending Triangles
Descending triangles are basically the opposite of ascending triangles.
Sellers are continuing to put pressure on the buyers, and as a result, we start to see lower highs met by a strong support level.
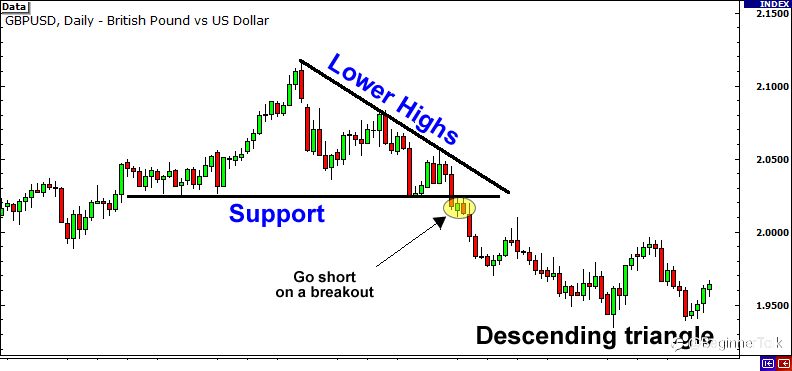
Descending triangles are generally bearish signals. To take advantage of this, our goal is to position ourselves to go short if the price should breakout below the support level.
Symmetrical Triangles
The third type of triangle is the symmetrical triangle.
Rather than having a horizontal support or resistance level, both the bulls and the bears create higher lows and lower highs and form an apex somewhere in the middle.
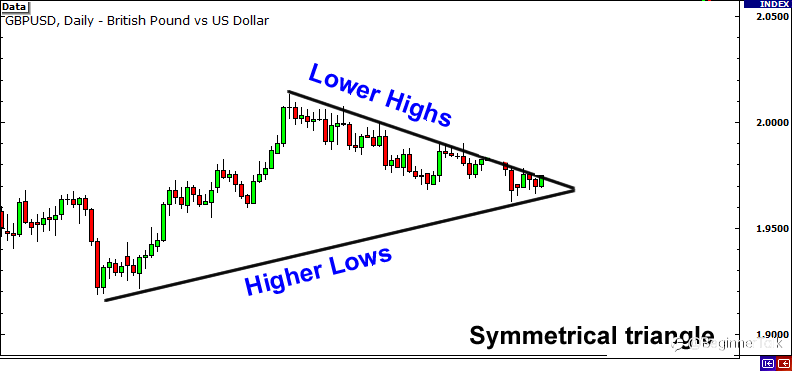
Unlike the ascending and descending triangles which are generally bullish and bearish signals, symmetrical triangles have NO directional bias.
You must be ready to trade a breakout on either side!
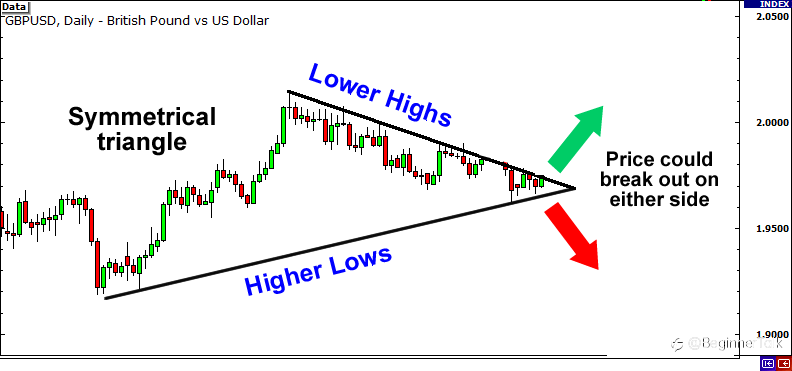
In the case of the symmetrical triangle, you want to position yourself to be ready for both an upside or downside breakout.
A perfect time to use the one-cancels-the-other (OCO) order! Don’t remember what an OCO order is? Go review your types of orders!
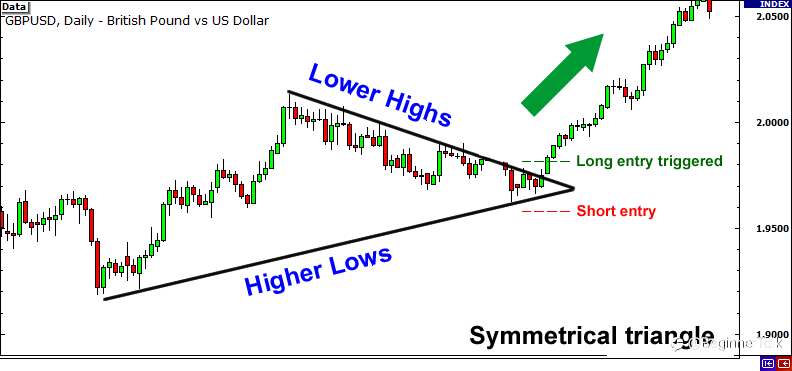
In this scenario, GBP/USD broke out on the upside and our long entry was triggered.
Breaking down the Triangle Breakouts
To help you memorize the different types of triangle breakouts, just think of facial breakouts.
Ascending triangles usually break out to the upside. So when you think of ascending triangles, think of breaking out on your forehead.
Descending triangles usually break out to the downside. So when you think of descending triangles, think of breaking out on your chin.
Symmetrical triangles can break either to the upside or the downside. So when you think of symmetrical triangles, think of breaking out on both your chin and forehead.
“Why do you keep staring at my pimples?!”
Here’s a quick and disgusting memory tickler:
Ascending triangle = Forehead breakout
Descending triangle = Chin breakout
Symmetrical triangle = Forehead OR chin breakout
EWWWW!!!!
Gross eh? But we bet you’ll remember it!
Reprinted from Babypips,the copyright all reserved by the original author.
Edited 22 Jun 2021, 10:53
Disclaimer: The content above represents only the views of the author or guest. It does not represent any views or positions of FOLLOWME and does not mean that FOLLOWME agrees with its statement or description, nor does it constitute any investment advice. For all actions taken by visitors based on information provided by the FOLLOWME community, the community does not assume any form of liability unless otherwise expressly promised in writing.
FOLLOWME Trading Community Website: https://www.followme.com


Hot
No comment on record. Start new comment.