Support and Resistance

“Support and resistance” is one of the most widely used concepts in forex trading.
Strangely enough, everyone seems to have their own idea of how you should measure support and resistance.
Let’s take a look at the basics first.
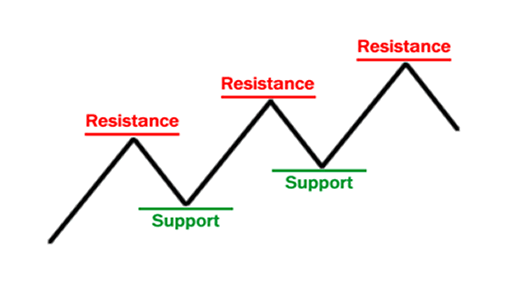
Look at the diagram above. As you can see, this zigzag pattern is making its way up (a “bull market”).
When the price moves up and then pulls back, the highest point reached before it pulled back is now resistance.Resistance levels indicate where there will be a surplus of sellers.
When the price continues up again, the lowest point reached before it started back is now support.
Support levels indicate where there will be a surplus of buyers.
In this way, resistance and support are continually formed as the price moves up and down over time.
The reverse is true during a downtrend.
In the most basic way, this is how support and resistance are normally traded:
Trade the “Bounce”
- Buy when the price falls towards support.
- Sell when the price rises towards resistance.
Trade the “Break”
- Buy when the price breaks up through resistance.
- Sell when the price breaks down through support.
A “bounce” and “break”? Say what? If you’re a little bit confused, no need to worry as we will cover these concepts in more detail later.
Plotting Support and Resistance Levels
One thing to remember is that support and resistance levels are not exact numbers.
Often times you will see a support or resistance level that appears broken, but soon after find out that the market was just testing it.With candlestick charts, these “tests” of support and resistance are usually represented by the candlestick shadows.

Notice how the shadows of the candles tested the 1.4700 support level.
At those times it seemed like the market was “breaking” support.
In hindsight, we can see that the market was merely testing that level.
So how do we truly know if support and resistance were broken?
There is no definite answer to this question. Some argue that a support or resistance level is broken if the price can actually close past that level. However, you will find that this is not always the case.
Let’s take our same example from above and see what happened when the price actually closed past the 1.4700 support level.

In this case, the price had closed below the 1.4700 support level but ended up rising back up above it.
If you had believed that this was a real breakout and sold this pair, you would’ve been seriously hurtin’!
Looking at the chart now, you can visually see and come to the conclusion that the support was not actually broken; it is still very much intact and now even stronger.
To help you filter out these false breakouts, you should think of support and resistance more as “zones” rather than concrete numbers.
One way to help you find these zones is to plot support and resistance on a line chart rather than a candlestick chart.The reason is that line charts only show you the closing price while candlesticks add the extreme highs and lows to the picture.
These highs and lows can be misleading because oftentimes they are just the “knee-jerk” reactions of the market.
It’s like when someone is doing something really strange, but when asked about it, he or she simply replies, “Sorry, it’s just a reflex.”
When plotting support and resistance, you don’t want the reflexes of the market. You only want to plot its intentional movements.
Looking at the line chart, you want to plot your support and resistance lines around areas where you can see the price forming several peaks or valleys.

Other interesting tidbits about support and resistance:
- When the price passes through resistance, that resistance could potentially become support.
- The more often price tests a level of resistance or support without breaking it, the stronger the area of resistance or support is.
- When a support or resistance level breaks, the strength of the follow-through move depends on how strongly the broken support or resistance had been holding.

With a little practice, you’ll be able to spot potential forex support and resistance areas easily.
In the next lesson, we’ll teach you how to trade diagonal support and resistance lines, otherwise known as trend lines.
Reprinted from Babypips, the copyright all reserved by the original author.
Disclaimer: The content above represents only the views of the author or guest. It does not represent any views or positions of FOLLOWME and does not mean that FOLLOWME agrees with its statement or description, nor does it constitute any investment advice. For all actions taken by visitors based on information provided by the FOLLOWME community, the community does not assume any form of liability unless otherwise expressly promised in writing.
FOLLOWME Trading Community Website: https://www.followme.com


Hot
No comment on record. Start new comment.