GBP/USD - Day Trade View

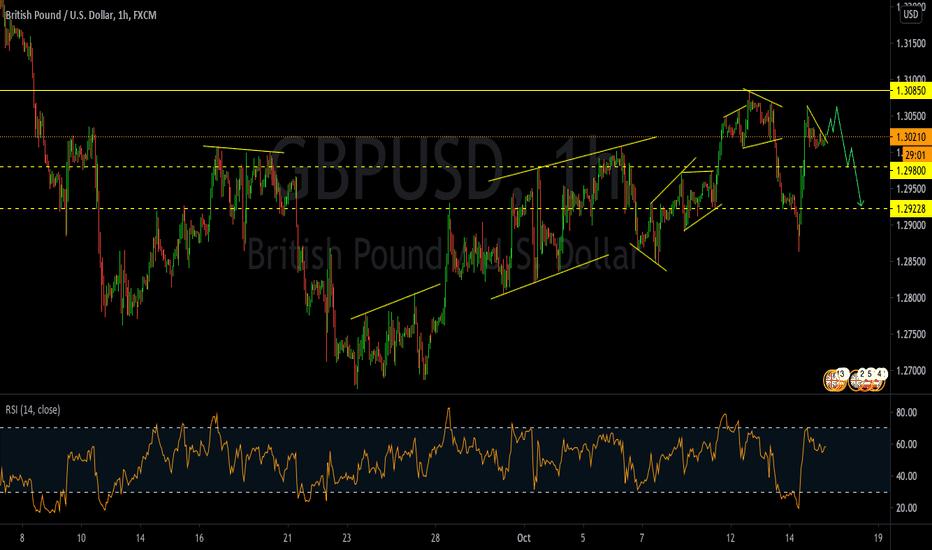
GBP/USD - Trading close to the resistance on hourly chart, based on the price action and chart patterns it is expected to go down.
My approach will be a sell from current price 1.30200 to 1.30600 ( sell on every rise till there )
Maintain stop loss around 1.30900
Potential downside target 1.29800 - 1.29200
Road map is drawn on the chart based on hourly candles.
Edited 15 Oct 2020, 14:39
Disclaimer: The content above represents only the views of the author or guest. It does not represent any views or positions of FOLLOWME and does not mean that FOLLOWME agrees with its statement or description, nor does it constitute any investment advice. For all actions taken by visitors based on information provided by the FOLLOWME community, the community does not assume any form of liability unless otherwise expressly promised in writing.
FOLLOWME Trading Community Website: https://www.followme.com


Hot
No comment on record. Start new comment.