EUR/USD FROM 10-14 AUG 2020

· Views 617
On the daily chart, we can the Selling candles but dont be traped by the market, it's just a re-test candle after a long wave up. There 2 pin bars up we can see on the D1 chart here, that means we can BUY from there.
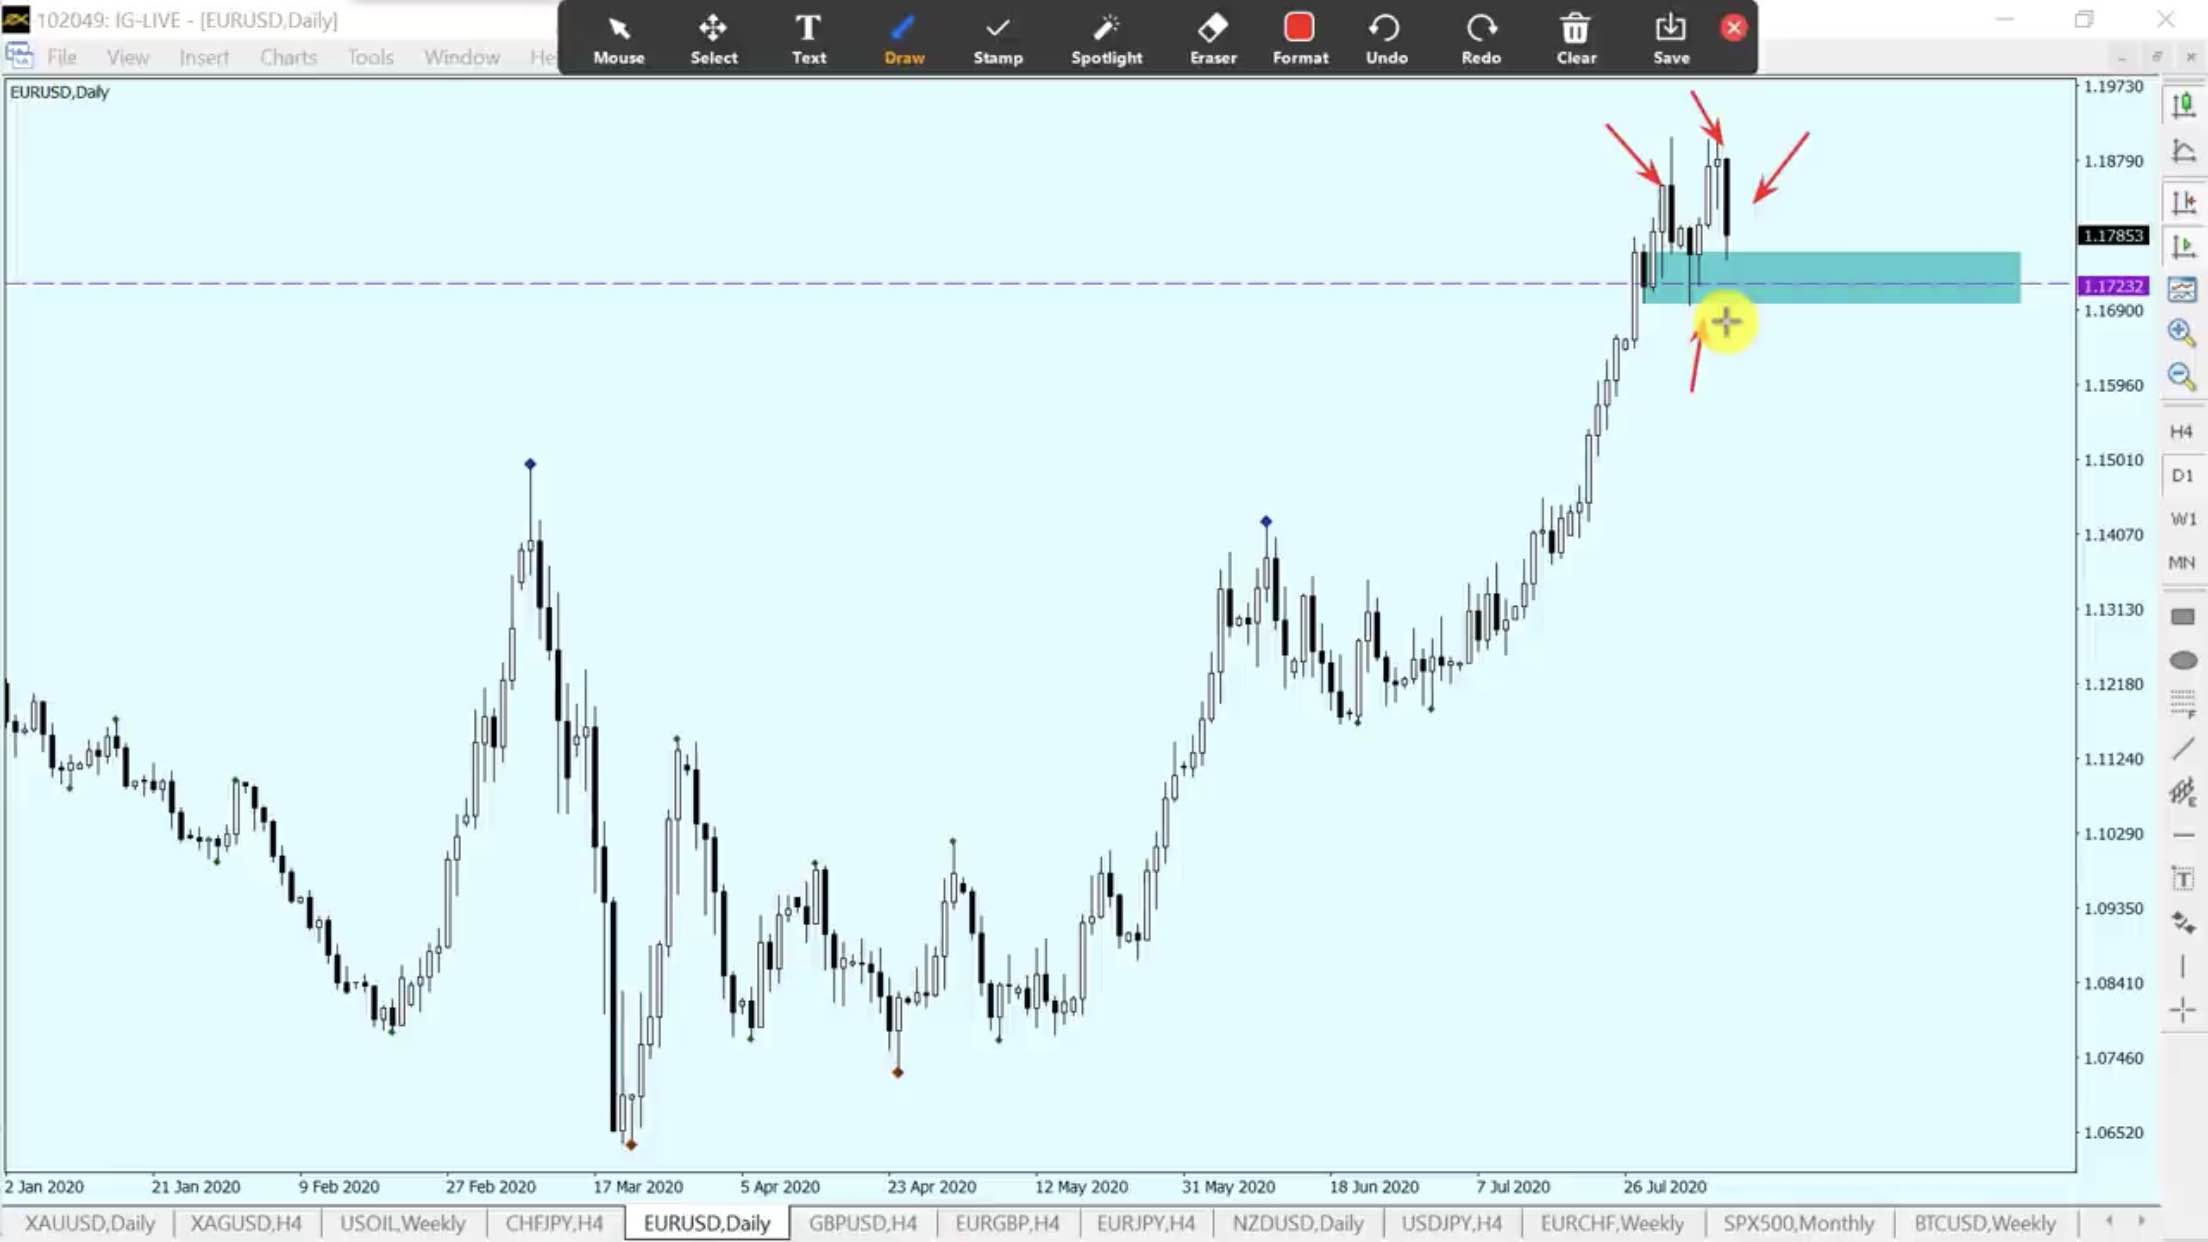
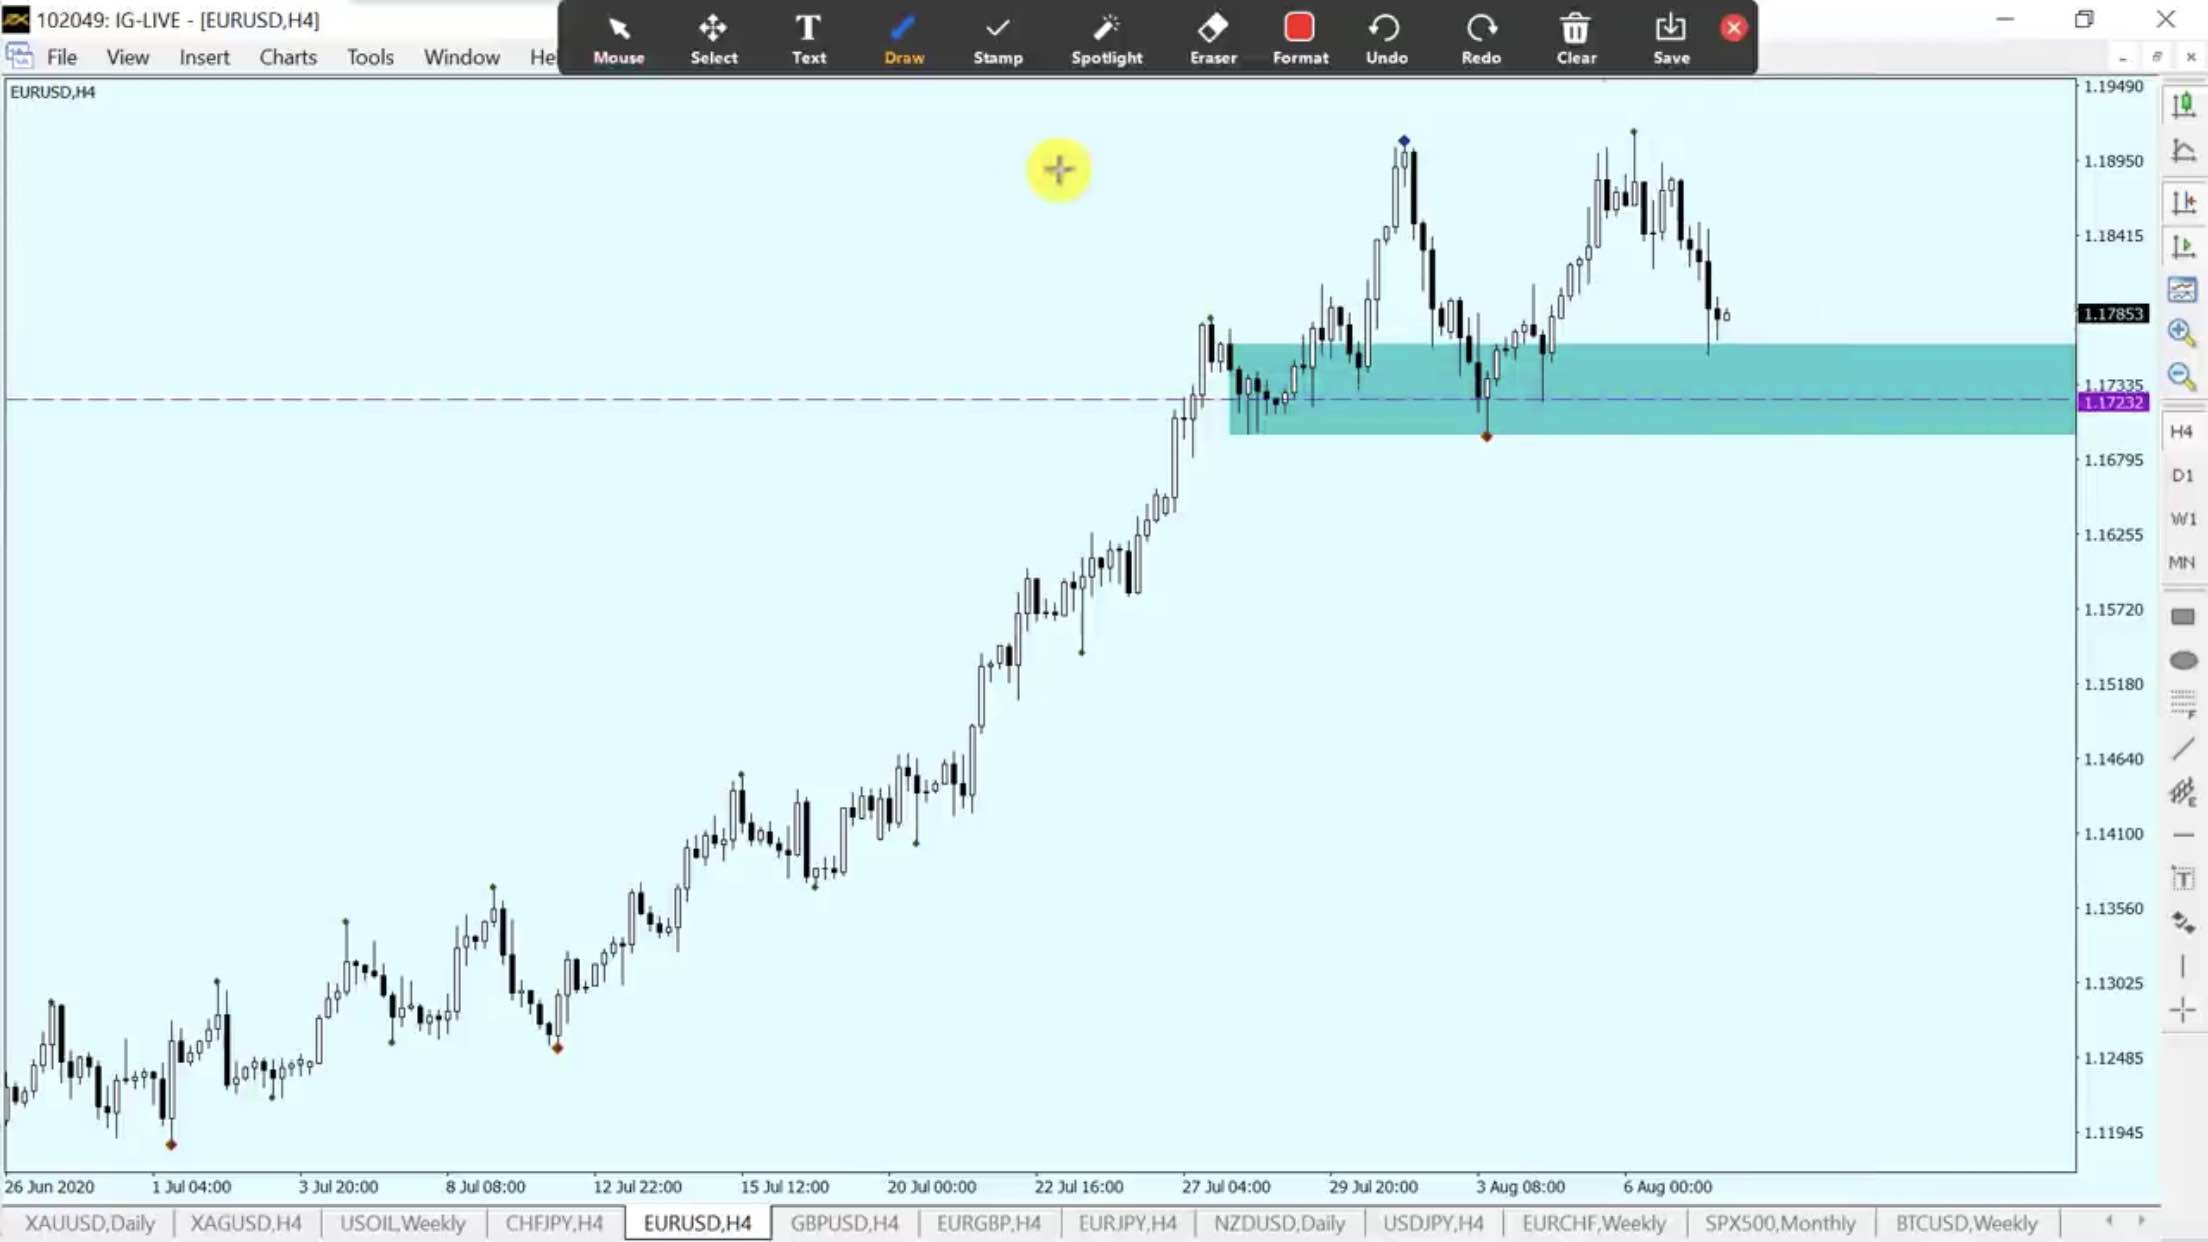
On the H4 chart, we can see clearly about the support area at the price 1.17232. Please wait for the price to arrive this area and a signal like pin bar up or inside bar to Buy.
Or you can BUY Limit at 1.17232, Stop loss at 1.16940, take profit at 1.1920 or 1.2000
This is my own opinion about the market, please always put stop loss to advoid risk.
Disclaimer: The content above represents only the views of the author or guest. It does not represent any views or positions of FOLLOWME and does not mean that FOLLOWME agrees with its statement or description, nor does it constitute any investment advice. For all actions taken by visitors based on information provided by the FOLLOWME community, the community does not assume any form of liability unless otherwise expressly promised in writing.
FOLLOWME Trading Community Website: https://www.followme.com
If you like, reward to support.


Hot
No comment on record. Start new comment.