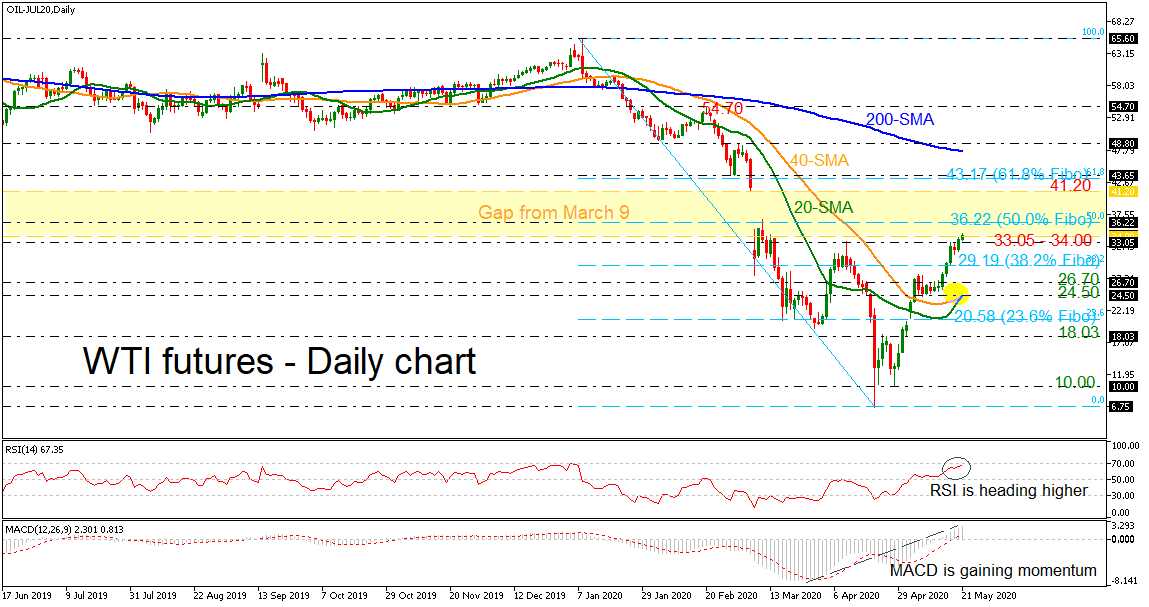
WTI creates 10-week high

The technical indicators are located in the bullish area, with the MACD stretching further above its red signal line and the RSI moving towards the 70 level. Yet, if the latter jumps in the overbought zone, it could also be an indication that the rally is overdone, and hence negative corrections should not be a surprise in coming sessions.
Traders may be eagerly looking for a break above today’s ten-week top at 34.41 to increase buying orders. If that’s the case, the rally could last until the 50.0% Fibonacci retracement level of the down leg from 65.60 to 6.75 at 36.22. If bullish forces appear even stronger, 41.20 should be another resistance to keep in mind ahead of the 61.8% Fibonacci at 43.17.
Should the price retreat, immediate support would come from the 33.05 – 34.00 area. Moving lower, the focus will shift to the 38.2% Fibo of 29.19, while lower still, a violation of the 24.50 – 26.70 region, which overlaps with the bullish cross of the short-term SMAs, would increase speculation that the bullish phase has ended, and a neutral mode is in progress. Below that, the 20.58 barrier, being the 23.6% Fibo, may pause bearish actions.
Disclaimer: The content above represents only the views of the author or guest. It does not represent any views or positions of FOLLOWME and does not mean that FOLLOWME agrees with its statement or description, nor does it constitute any investment advice. For all actions taken by visitors based on information provided by the FOLLOWME community, the community does not assume any form of liability unless otherwise expressly promised in writing.
FOLLOWME Trading Community Website: https://www.followme.com


Hot
No comment on record. Start new comment.