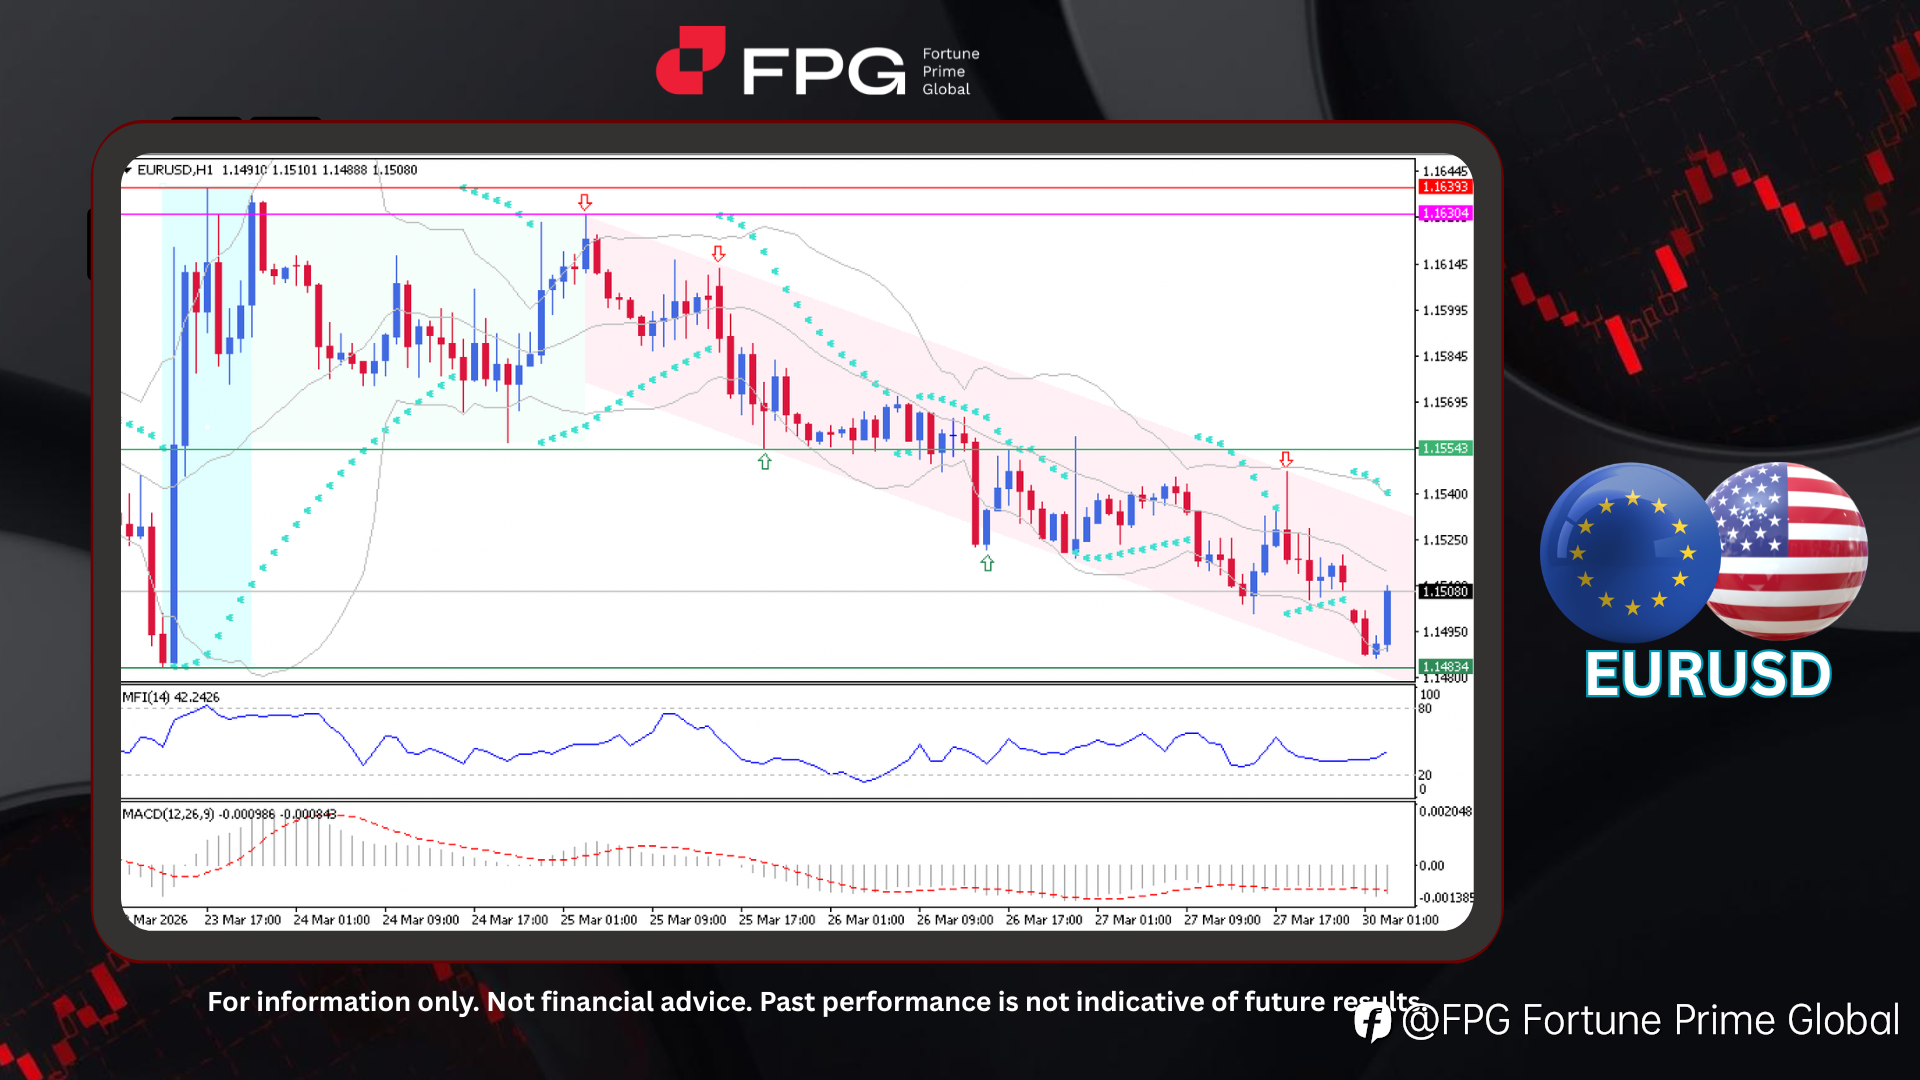
FPG EURUSD Market Report March 30, 2026
On the H1 timeframe chart, EURUSD showed a strong bullish rally at the beginning of last week, surging from 1.1483 to 1.1639. However, it failed to sustain the upward momentum from that peak, leading to a trend reversal into a consistent and prolonged bearish trend, forming a well-defined descending
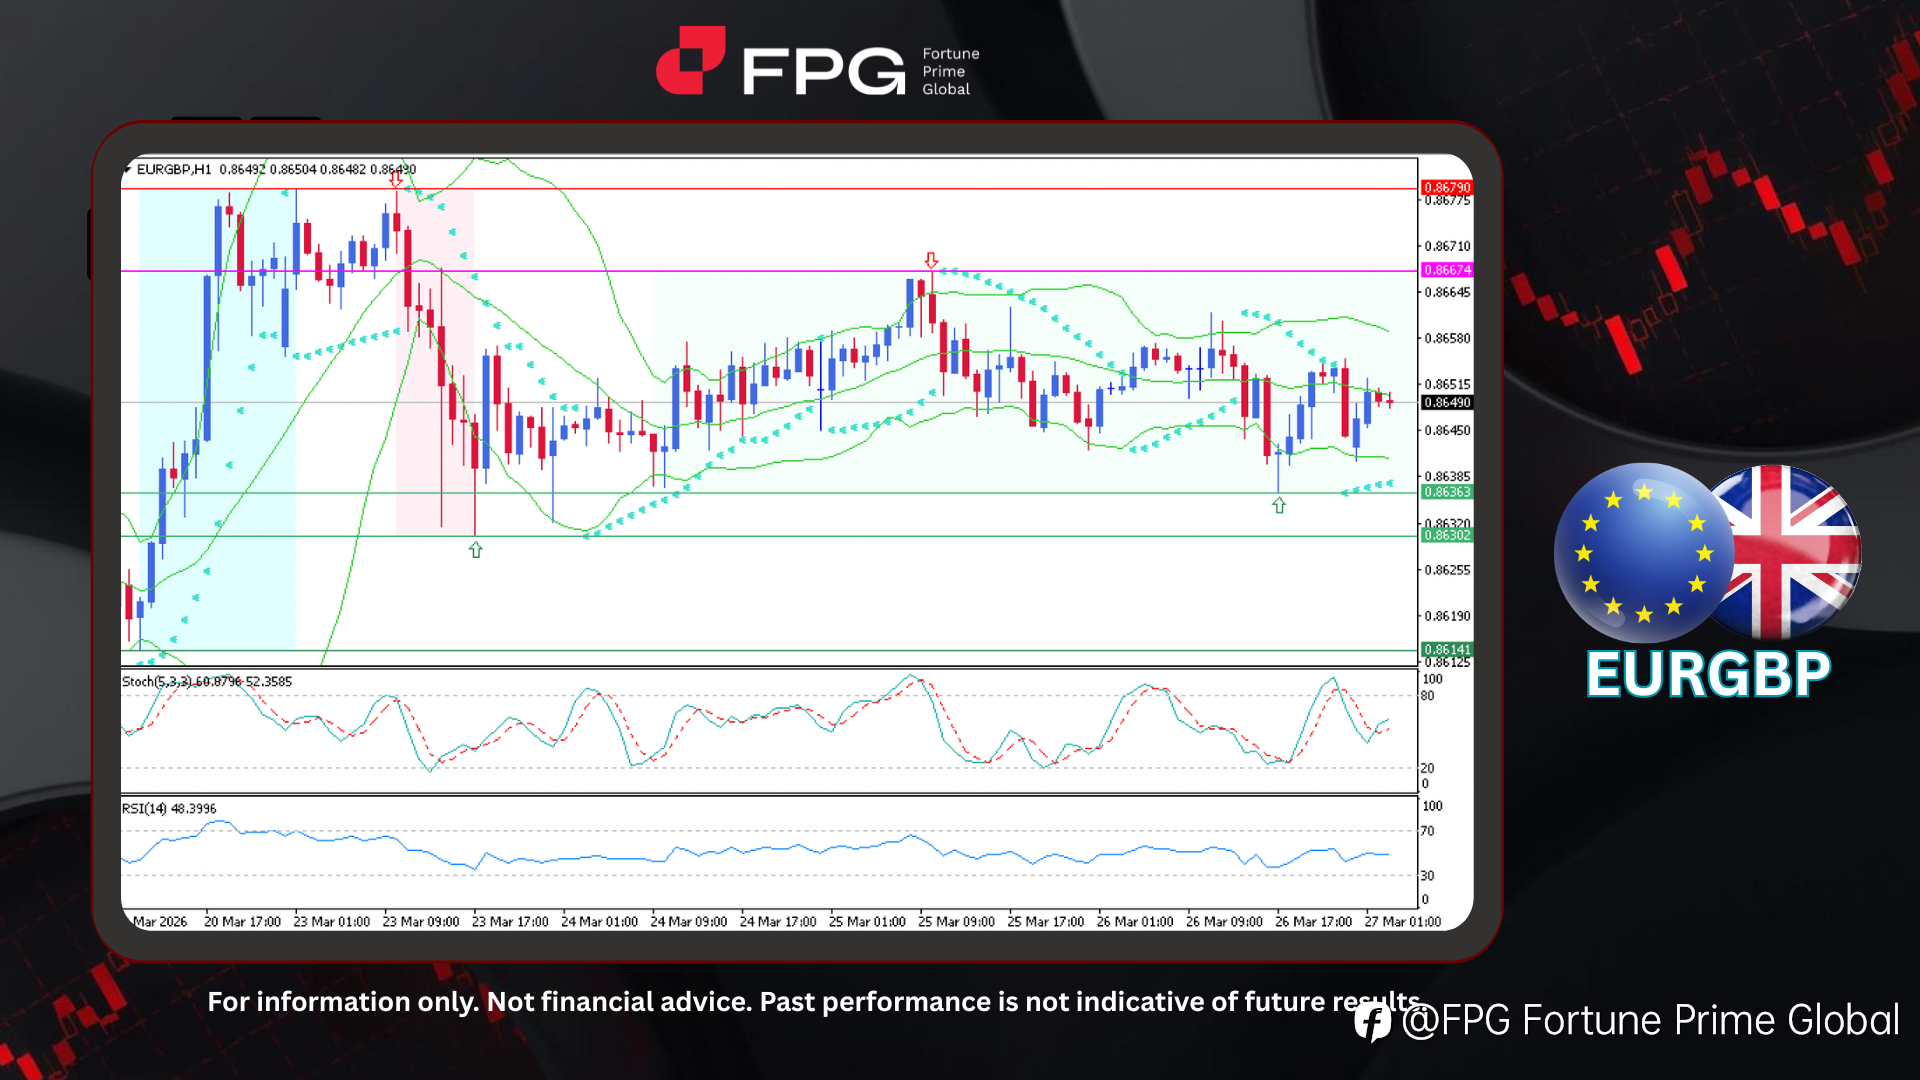
FPG EURGBP Market Report March 27, 2026
On the H1 timeframe chart, EURGBP showed a bullish rally last week, rising from 0.8614 and peaking at 0.8679. After several attempts to retest this resistance level, a price rejection occurred, leading to a bearish drop toward 0.8630. Following this move, price action stabilized and consolidated wit
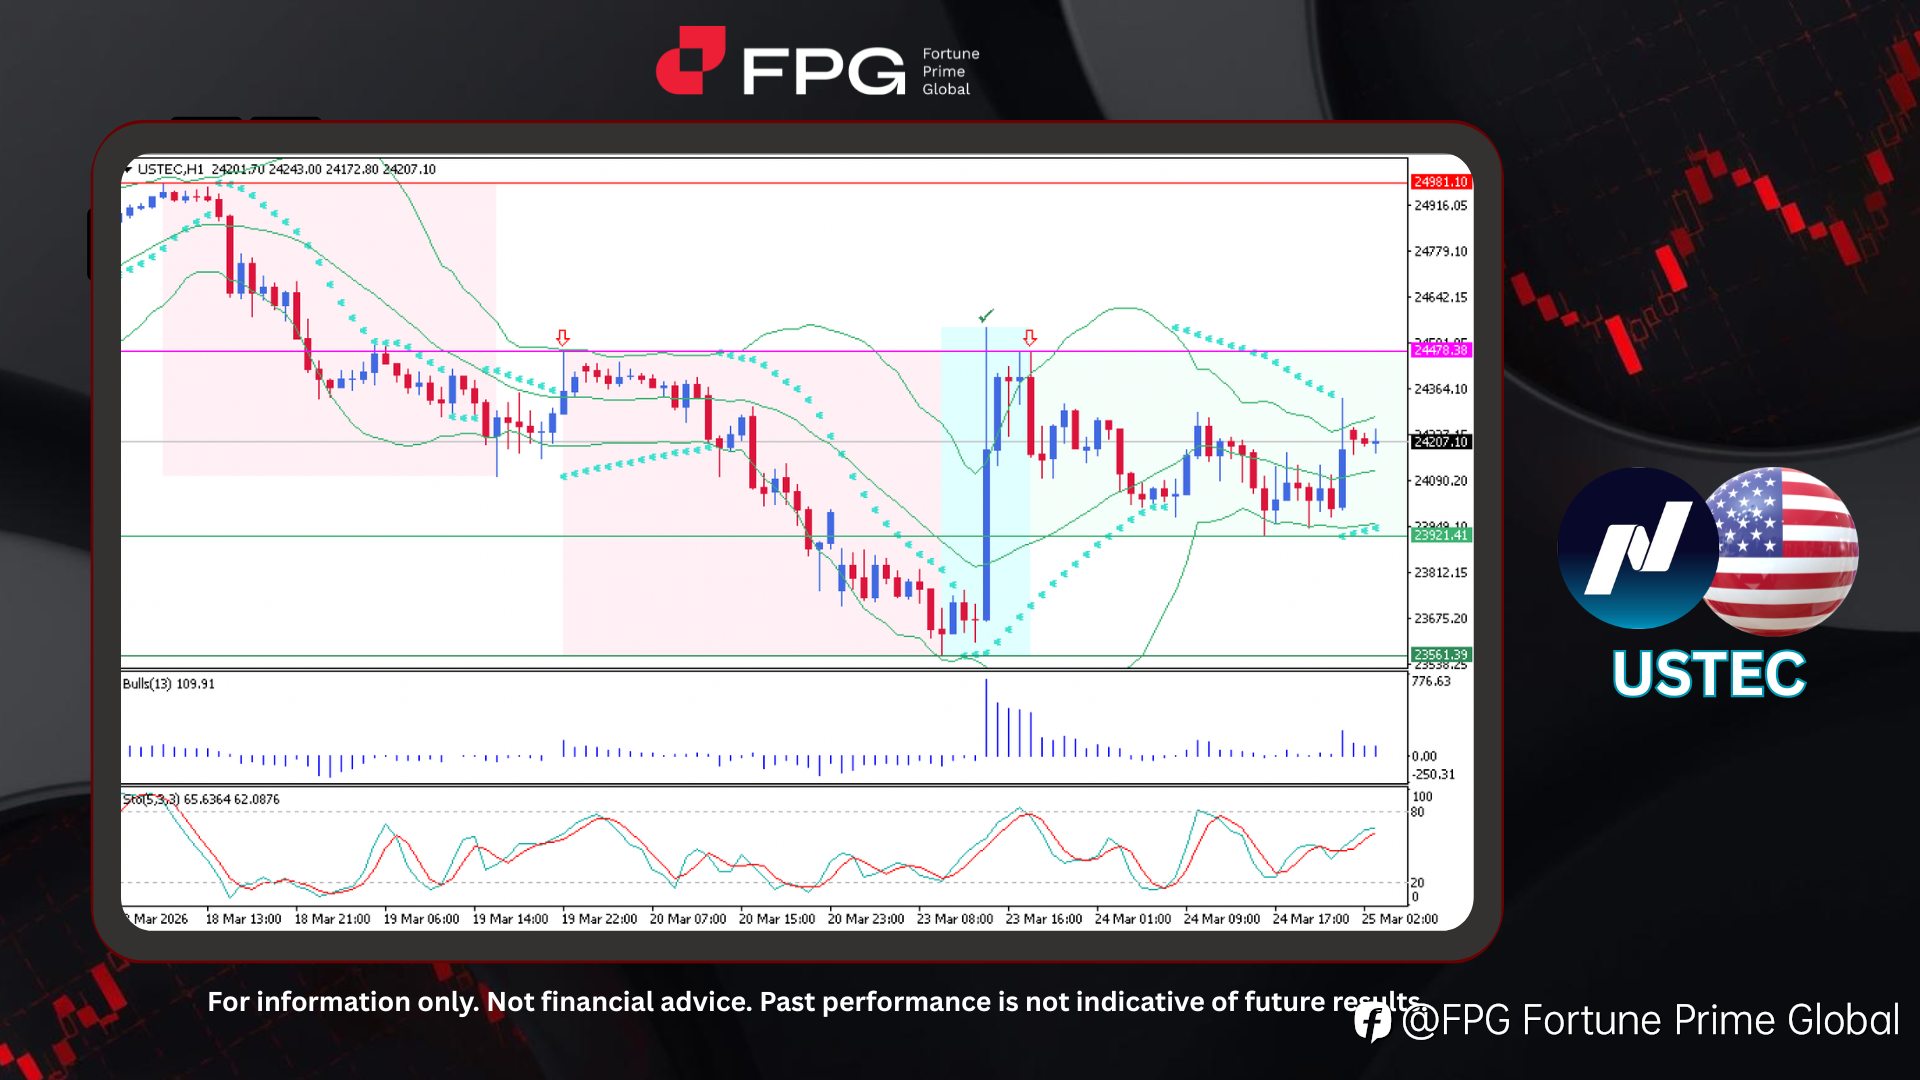
FPG USTEC Market Report March 25, 2026
On the H1 timeframe chart, USTEC recorded two consecutive bearish rallies last week, declining sharply from 24,981 to 23,561, reflecting strong selling pressure during that period. At the beginning of this week, price rebounded from the 23,561 level, forming a bullish reversal rally that pushed upwa
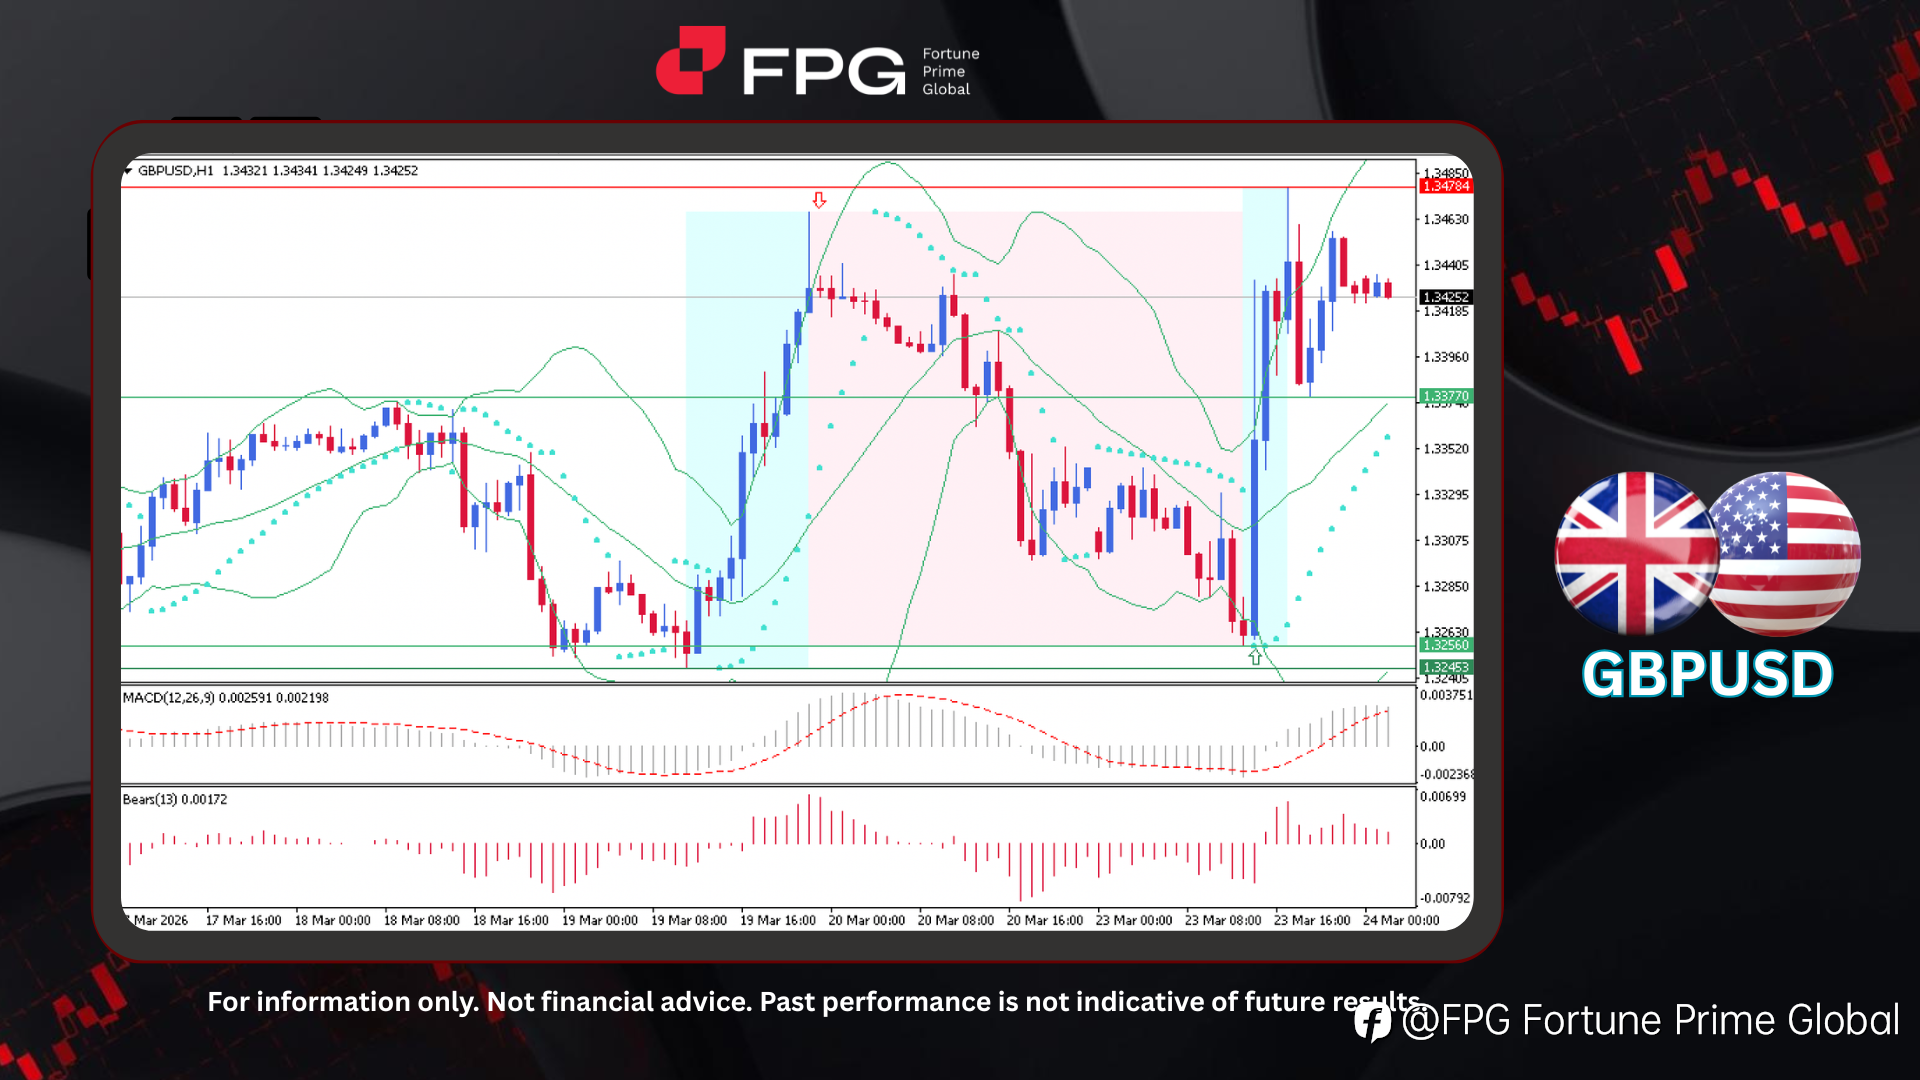
FPG GBPUSD Market Report March 24, 2026
On the H1 timeframe chart, GBPUSD shows highly volatile price behavior over the past sessions. In the middle of last week, the pair experienced a sharp bullish impulse, followed by a bearish correction phase, before reversing again from around 1.3256 into a strong bullish rally that pushed price tow
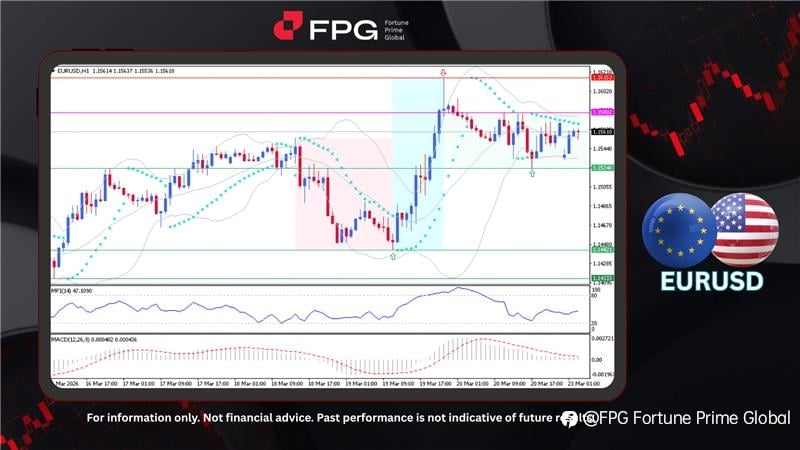
FPG EURUSD Market Report March 23, 2026
On the H1 timeframe chart, EURUSD previously experienced a bearish movement, followed by a bullish trend reversal from 1.1442 to 1.1615. After this upward move, price action stabilized and shifted into a sideways ranging structure between 1.1524 and 1.1580. The current price is trading around 1.1561
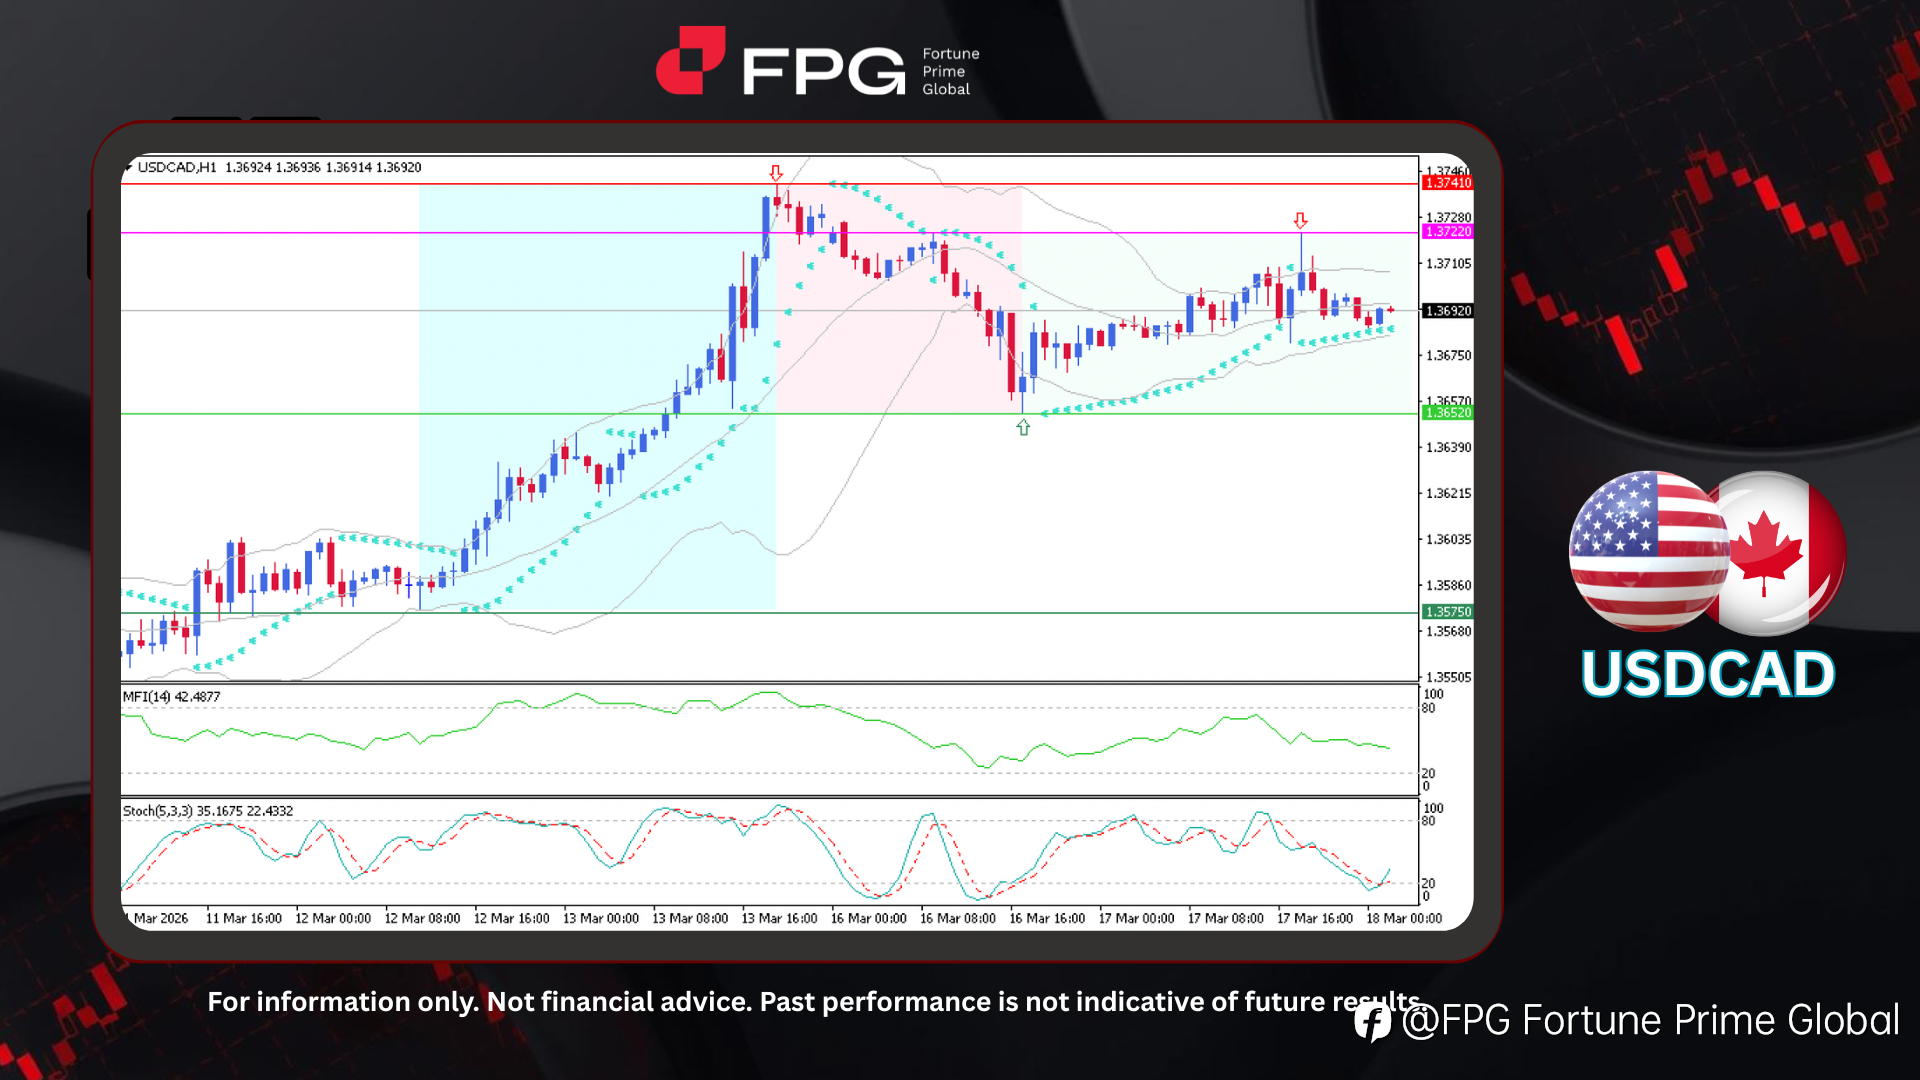
FPG USDCAD Market Report March 18, 2026
On the H1 chart, USDCAD initially experienced a strong bullish rally from 1.3575 to 1.3741, highlighting solid short-term buying momentum. After reaching this peak, the pair faced clear price rejection, triggering a corrective decline toward 1.3652. Currently, the price is hovering around 1.3692, sh
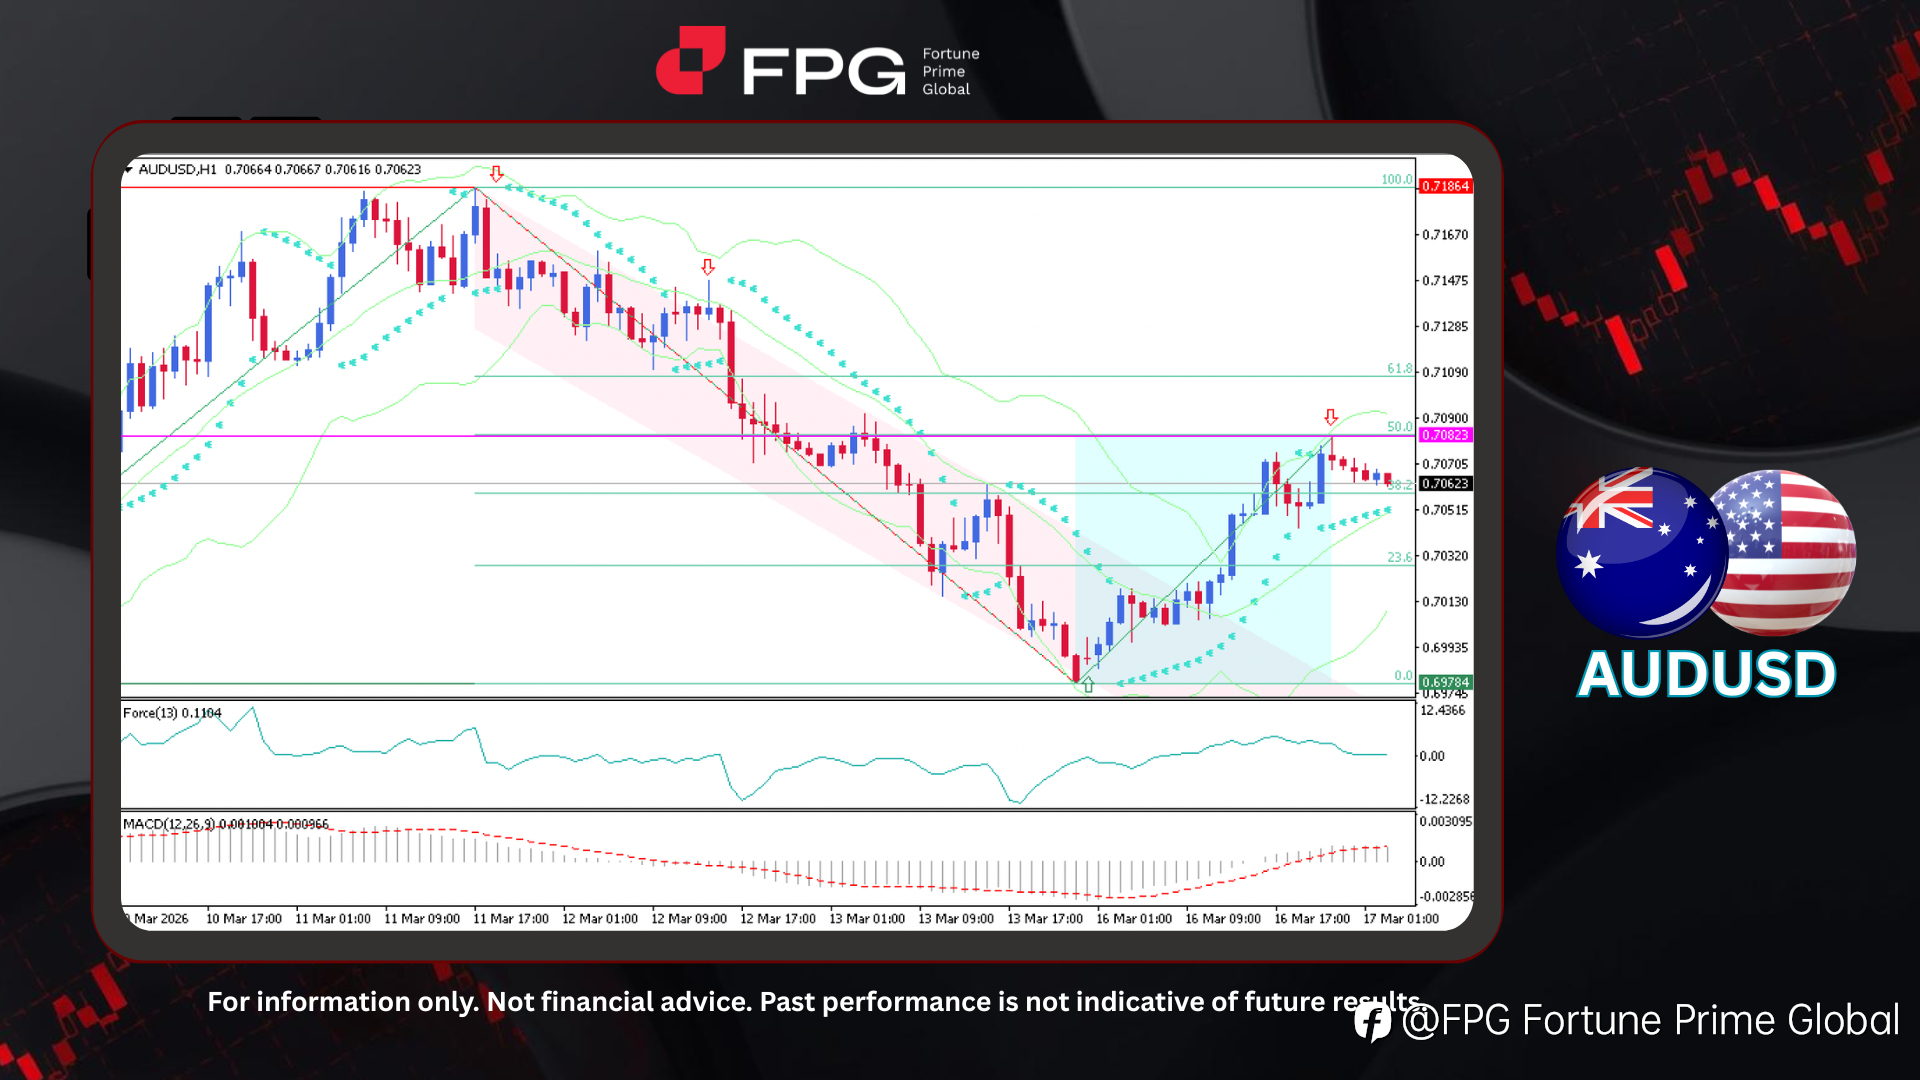
FPG AUDUSD Market Report March 17, 2026
On the H1 timeframe chart, AUDUSD previously experienced a sharp decline from 0.7186 to 0.6978, forming a clearly defined bearish channel during the downward move. Price briefly moved outside the channel structure but soon corrected and returned back within the channel boundaries, confirming the per
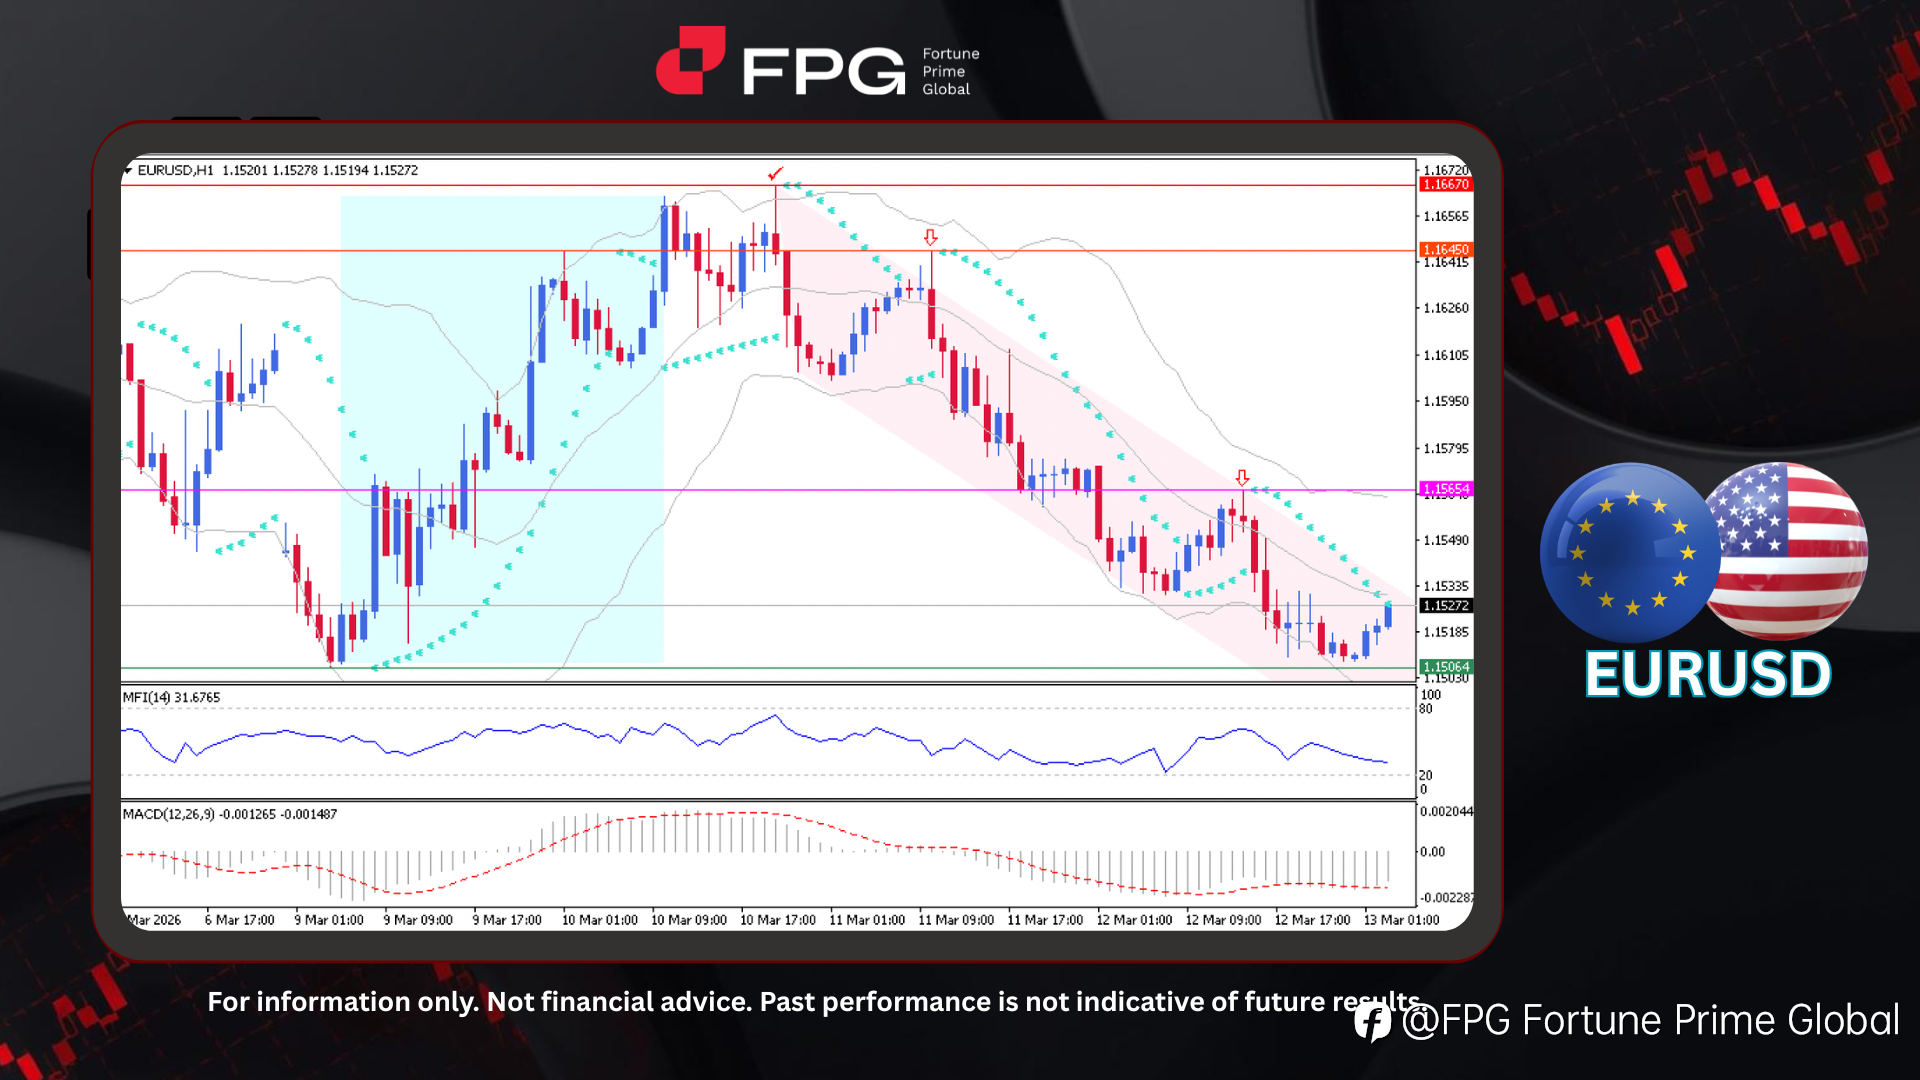
FPG EURUSD Market Report March 13, 2026
On the H1 timeframe chart, EURUSD experienced a bullish rally at the beginning of the week, rising from 1.1506 and peaking at 1.1667. From that peak, a bearish trend reversal emerged and has continued to develop, forming a clearly defined descending channel structure. Price briefly moved slightly ou
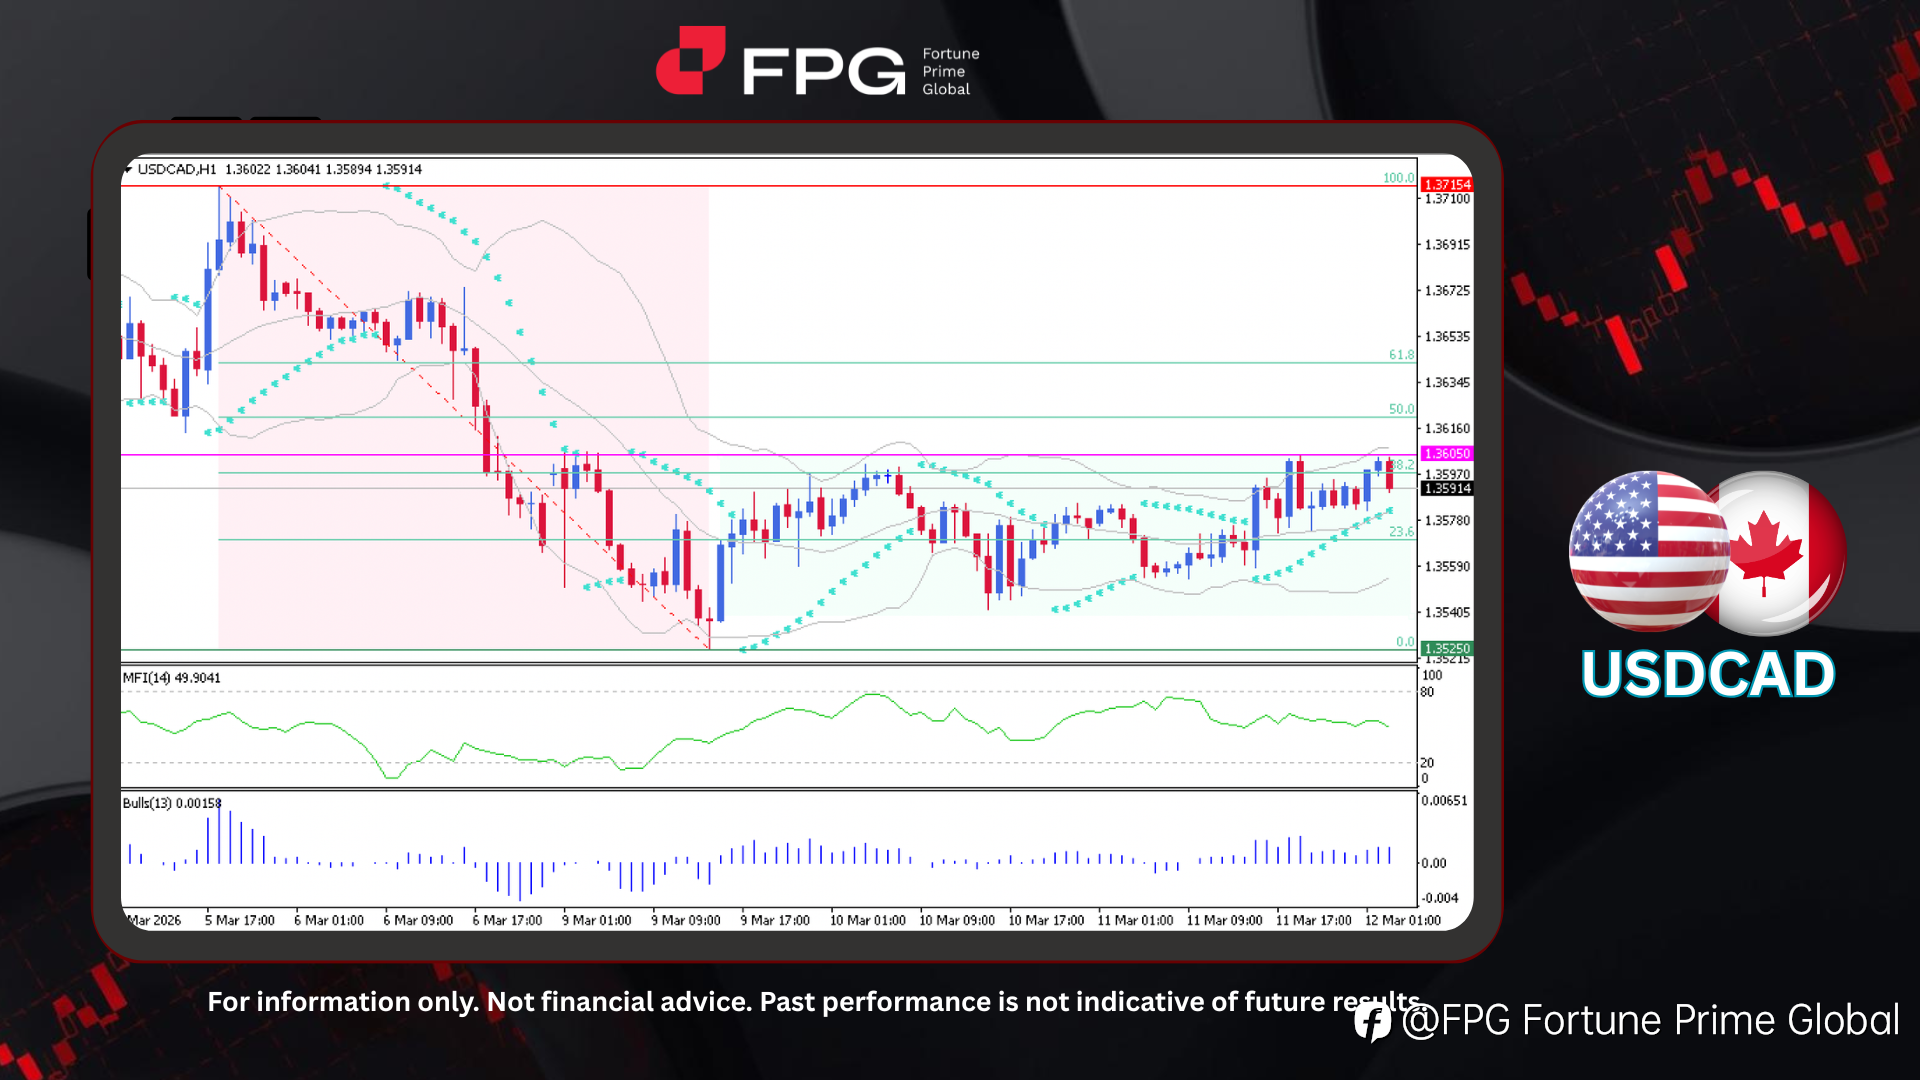
FPG USDCAD Market Report March 12, 2026
On the H1 timeframe chart, USDCAD previously experienced a bearish rally, declining from 1.3715 to 1.3525. Following this drop, the price entered a consolidation phase. Subsequent movement has been mostly sideways with a slight bullish bias, and the price has attempted to break above the 38.2% Fibon
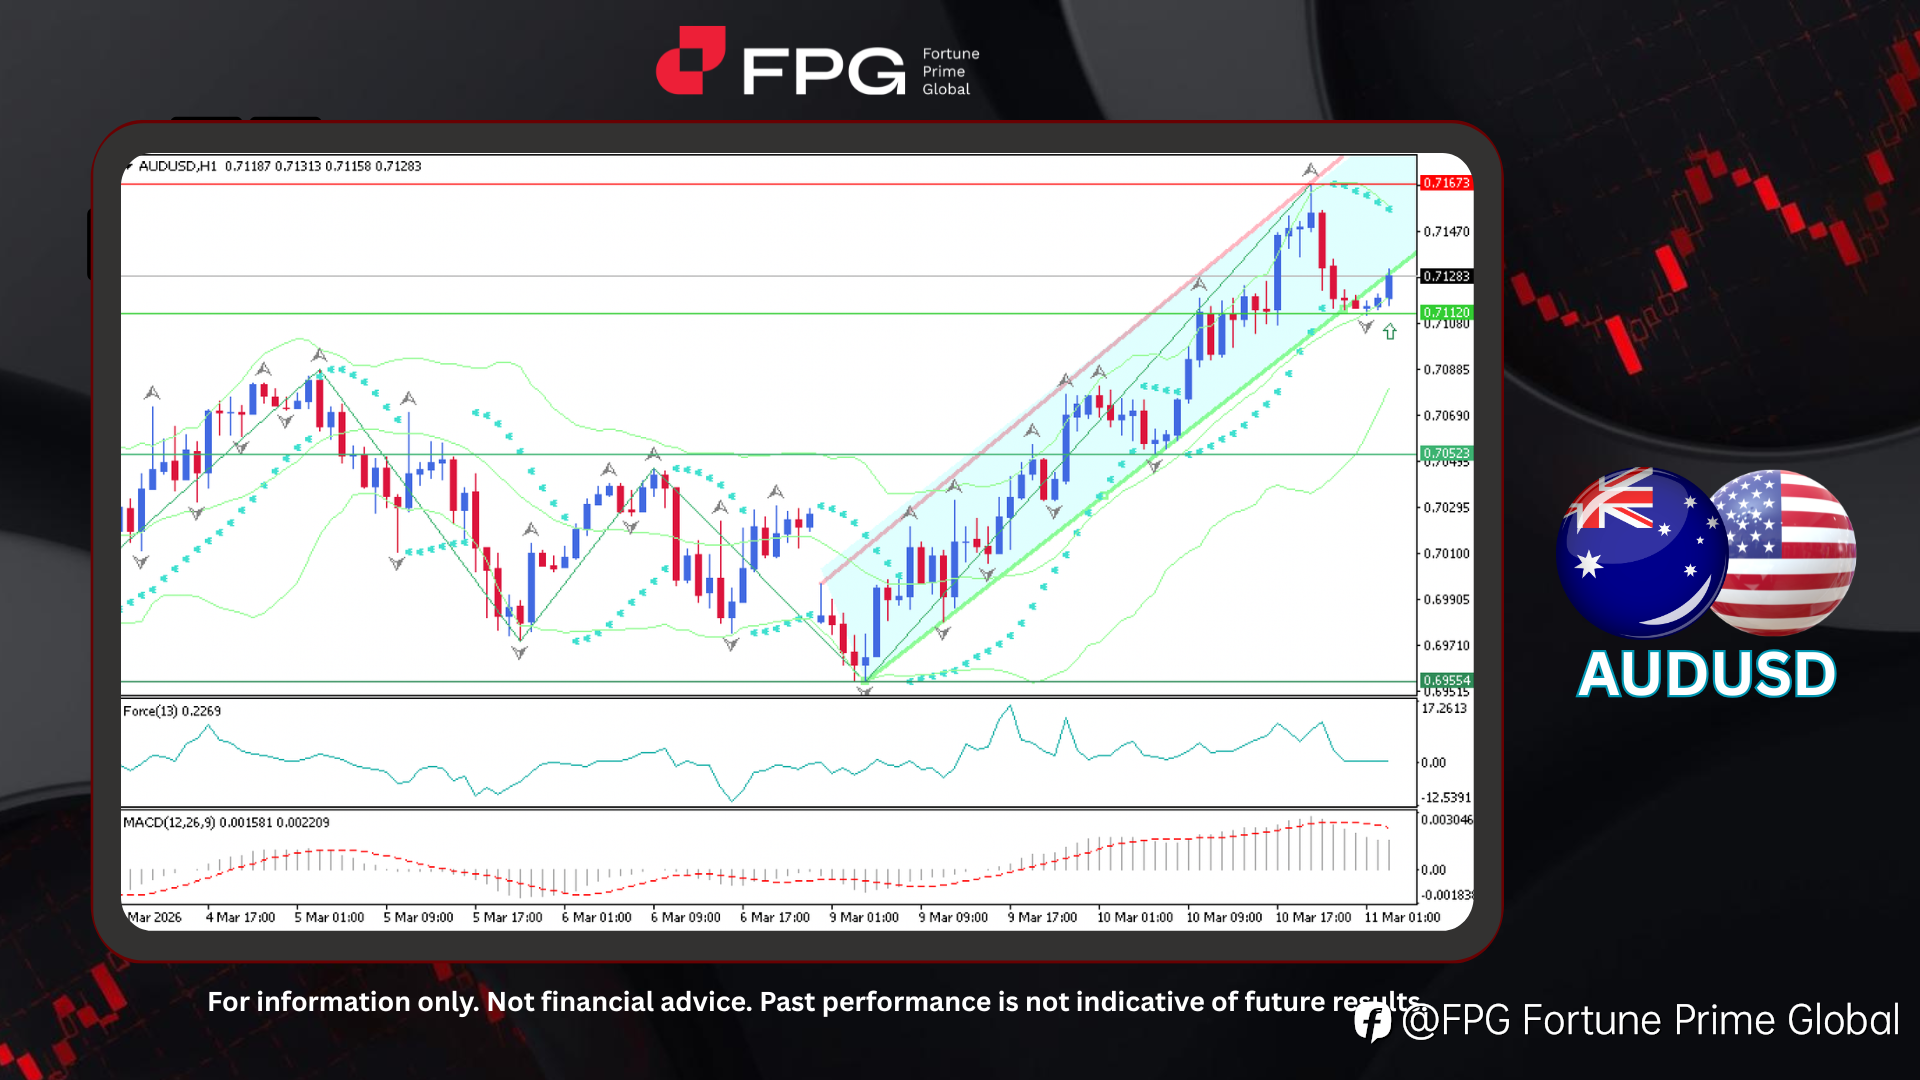
FPG AUDUSD Market Report March 11, 2026
On the H1 timeframe chart, AUDUSD is moving within a clearly defined bullish ascending channel that has developed over the recent sessions. The rally began from the 0.6955 low and advanced steadily toward the 0.7167 peak before encountering resistance. Currently, the pair is trading around 0.7128, a
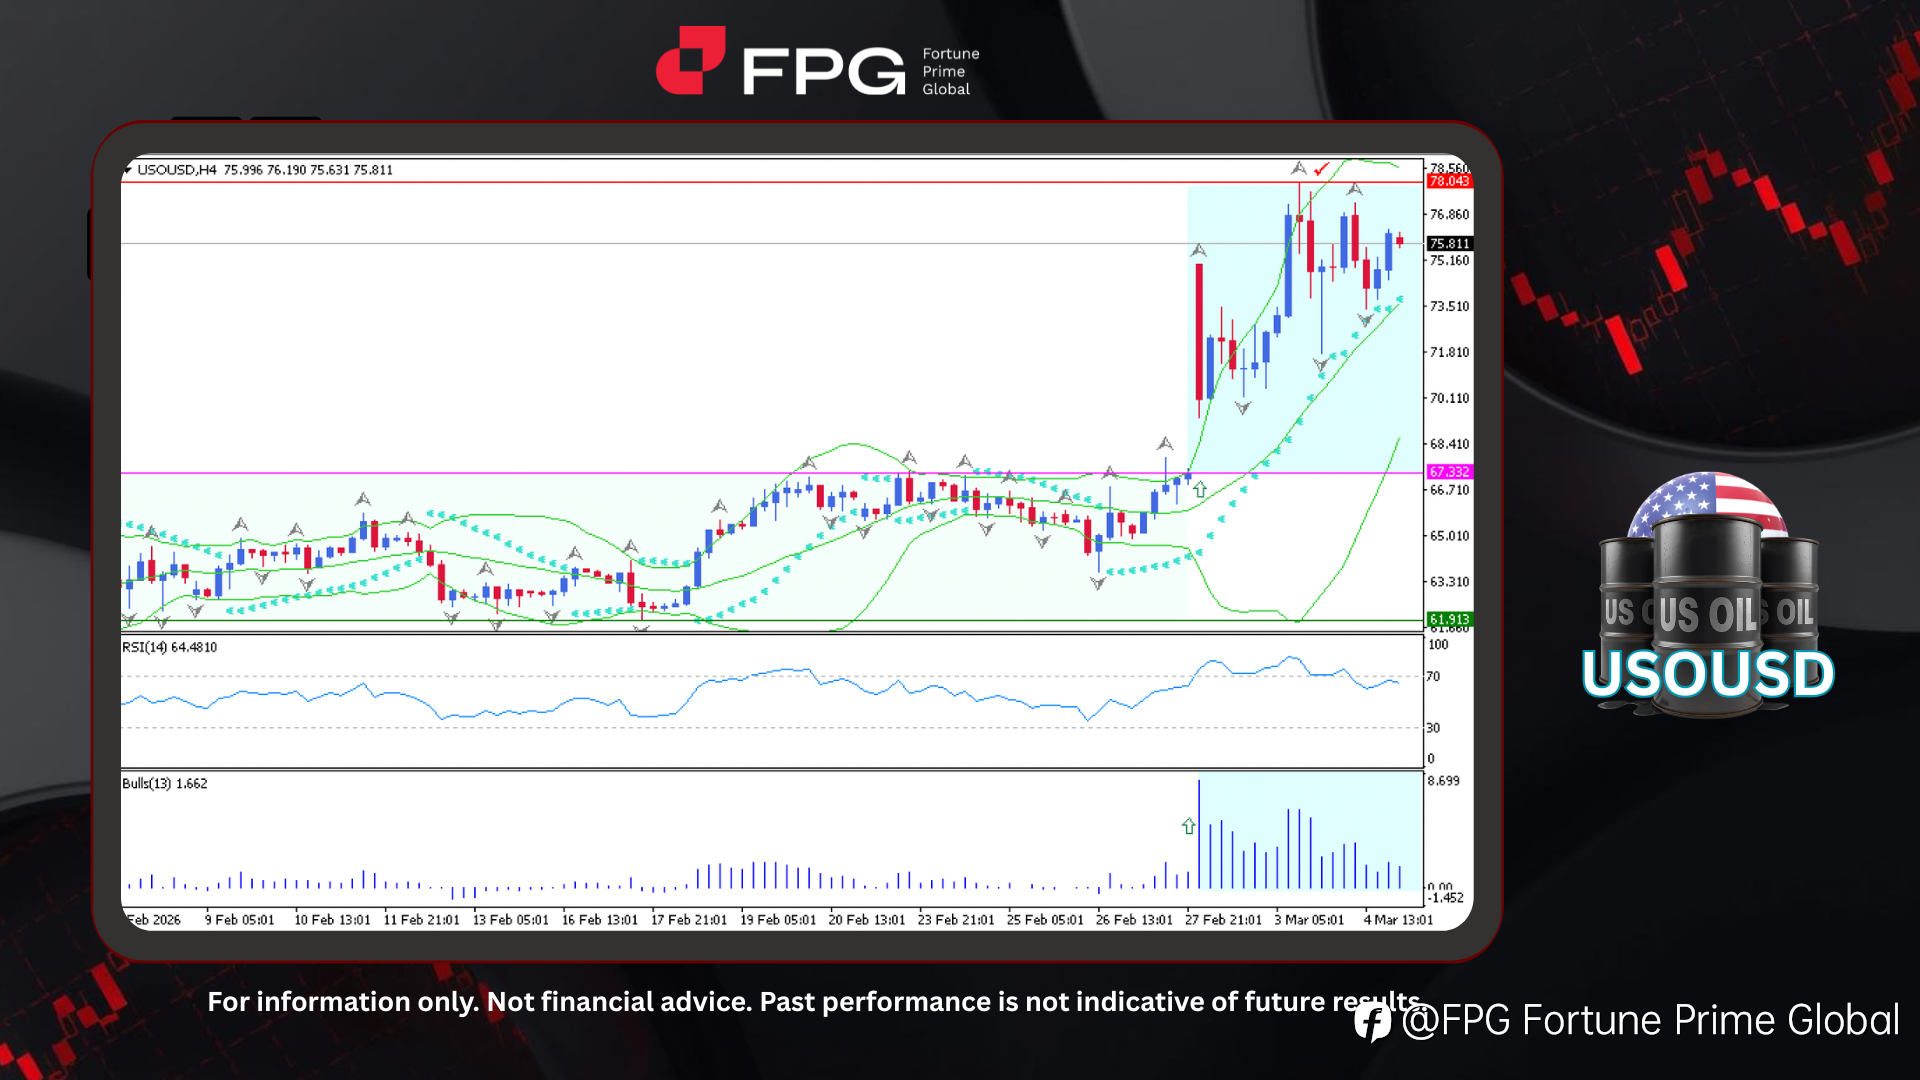
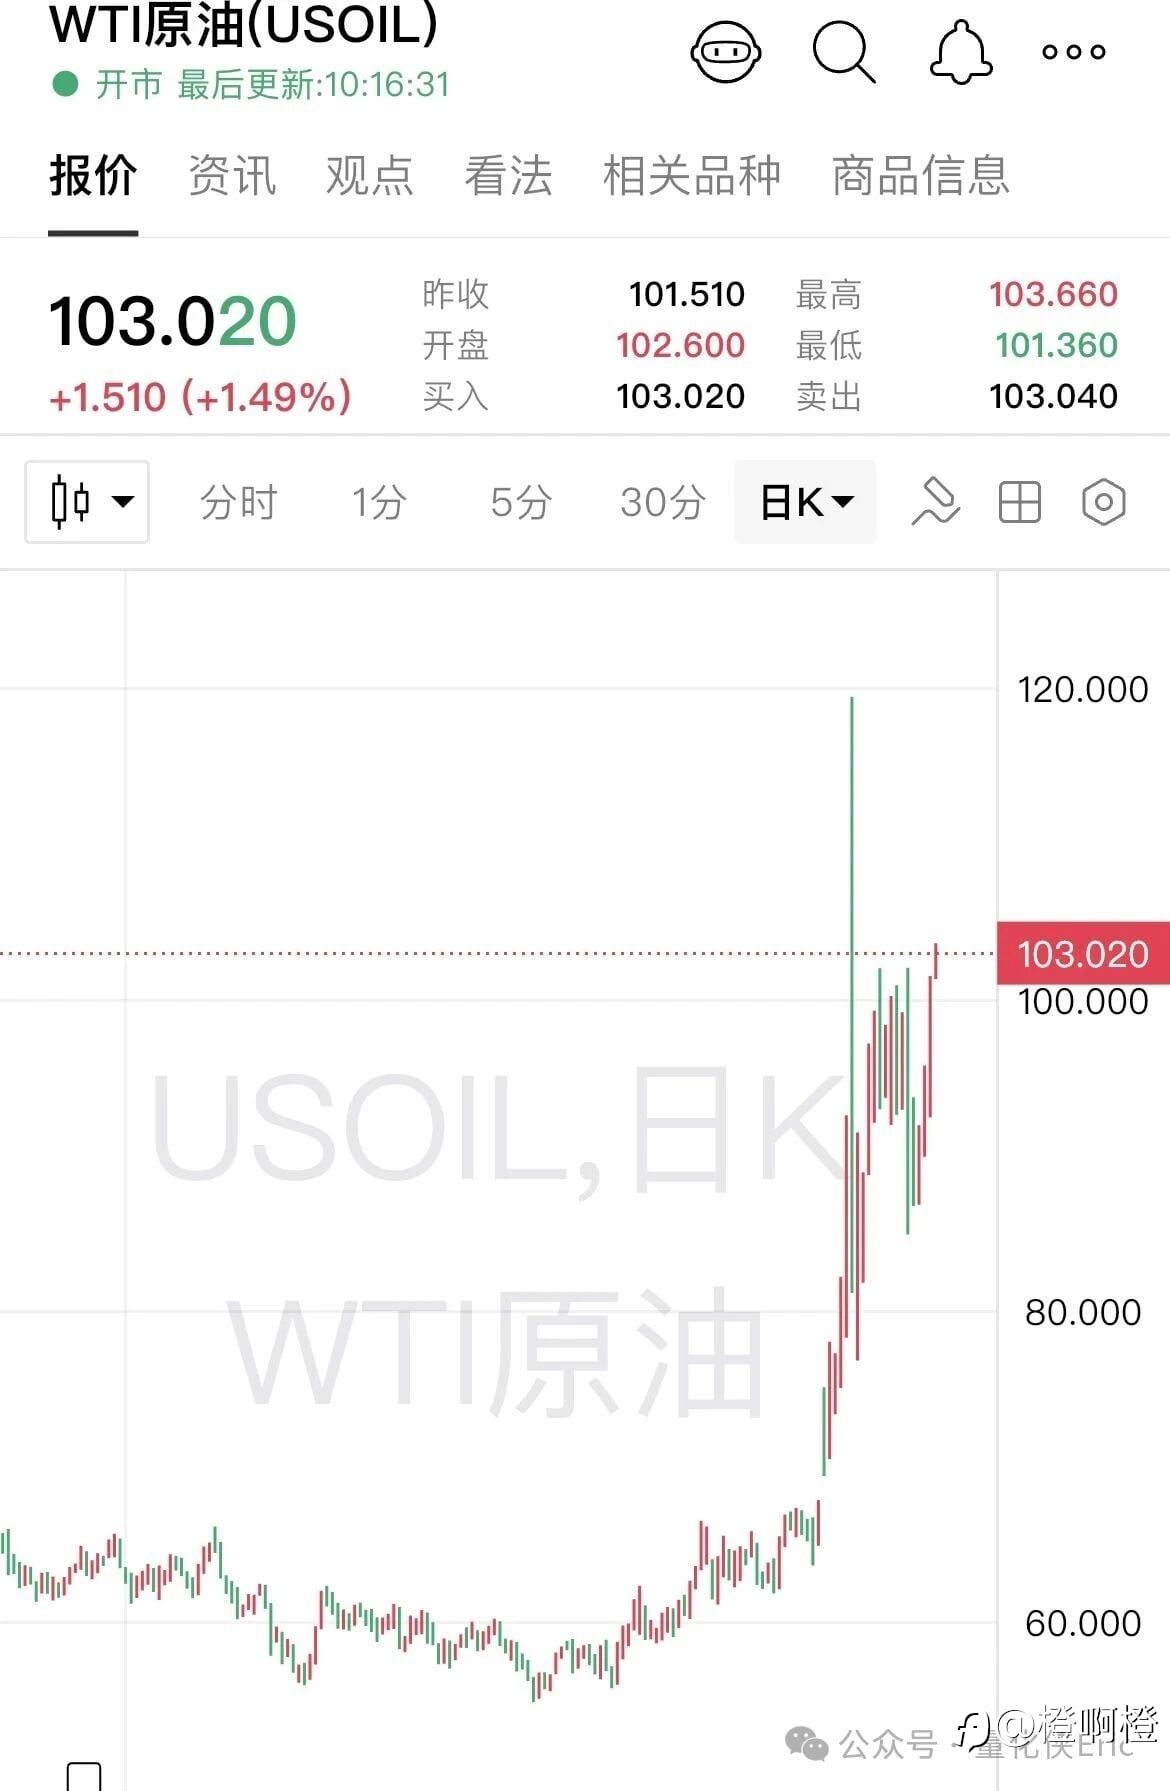
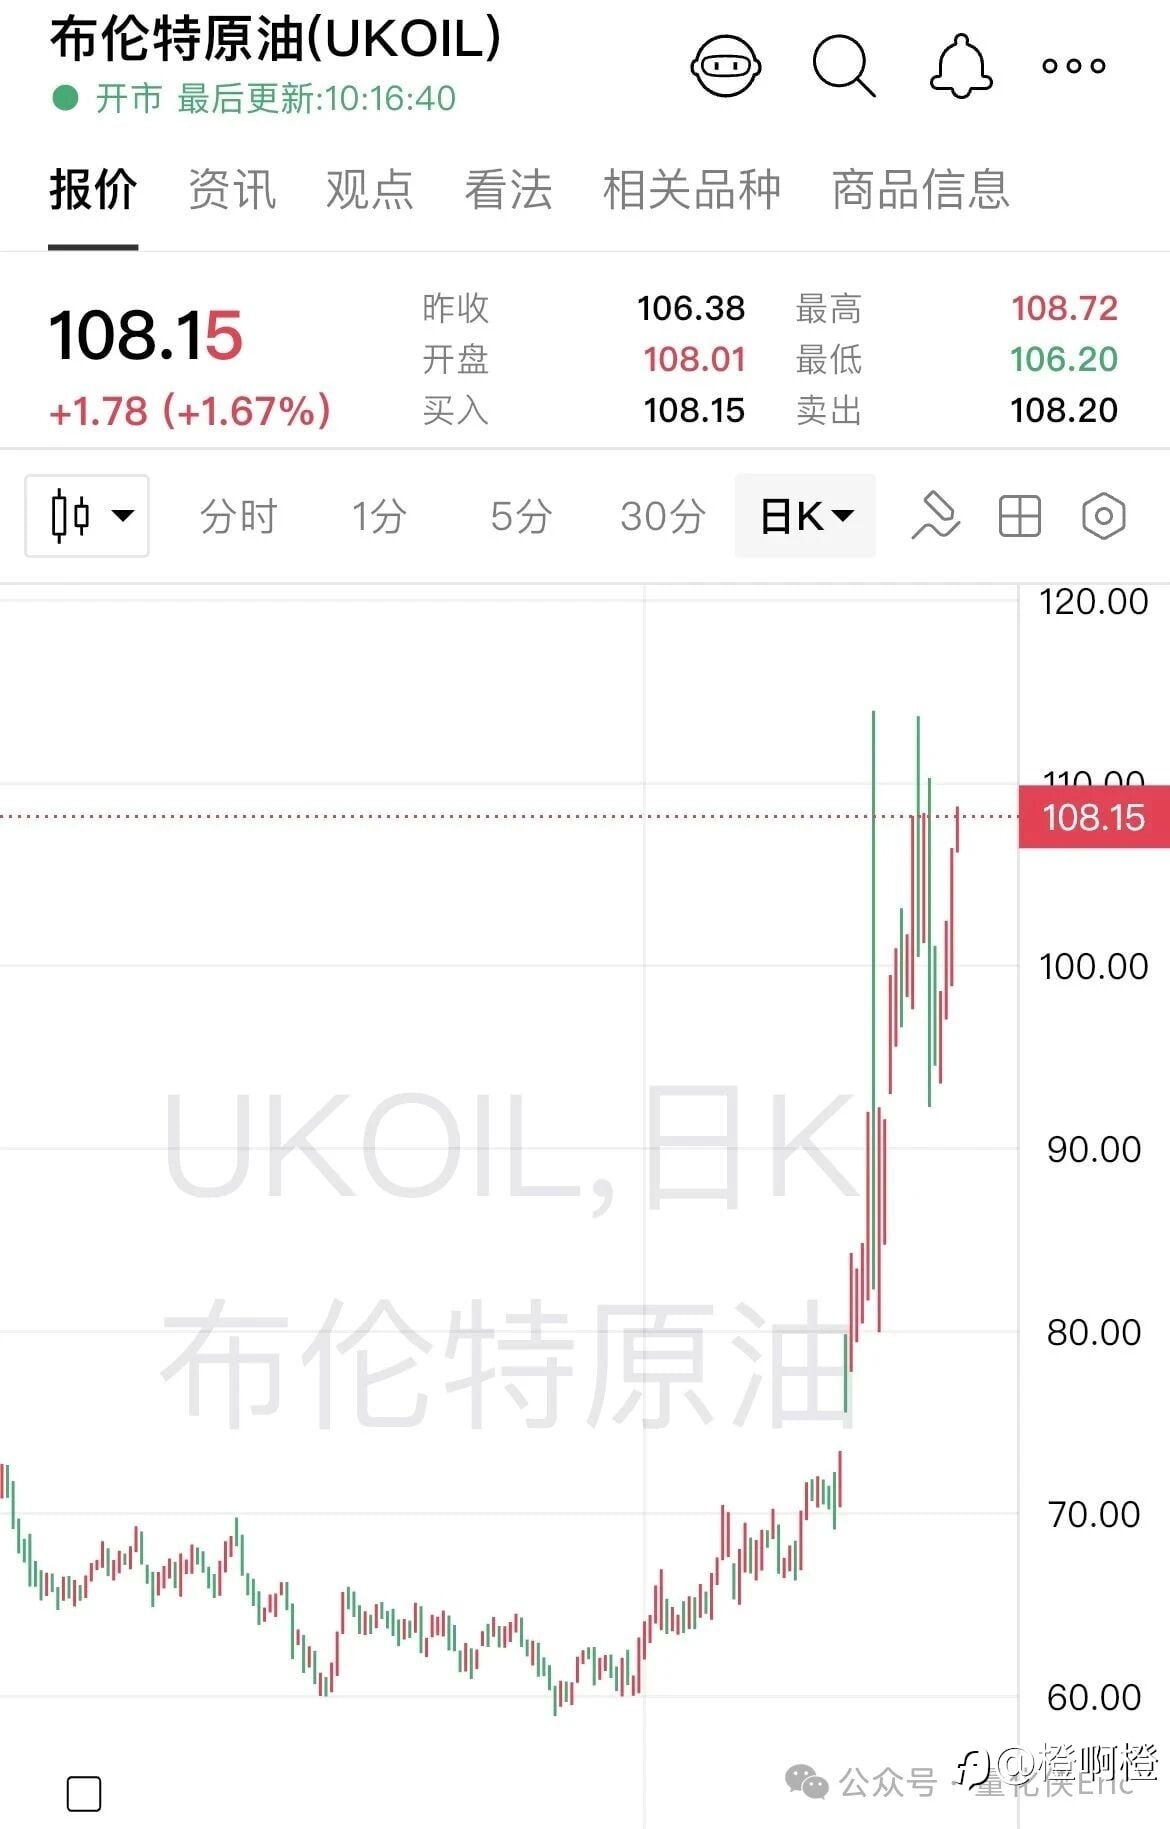
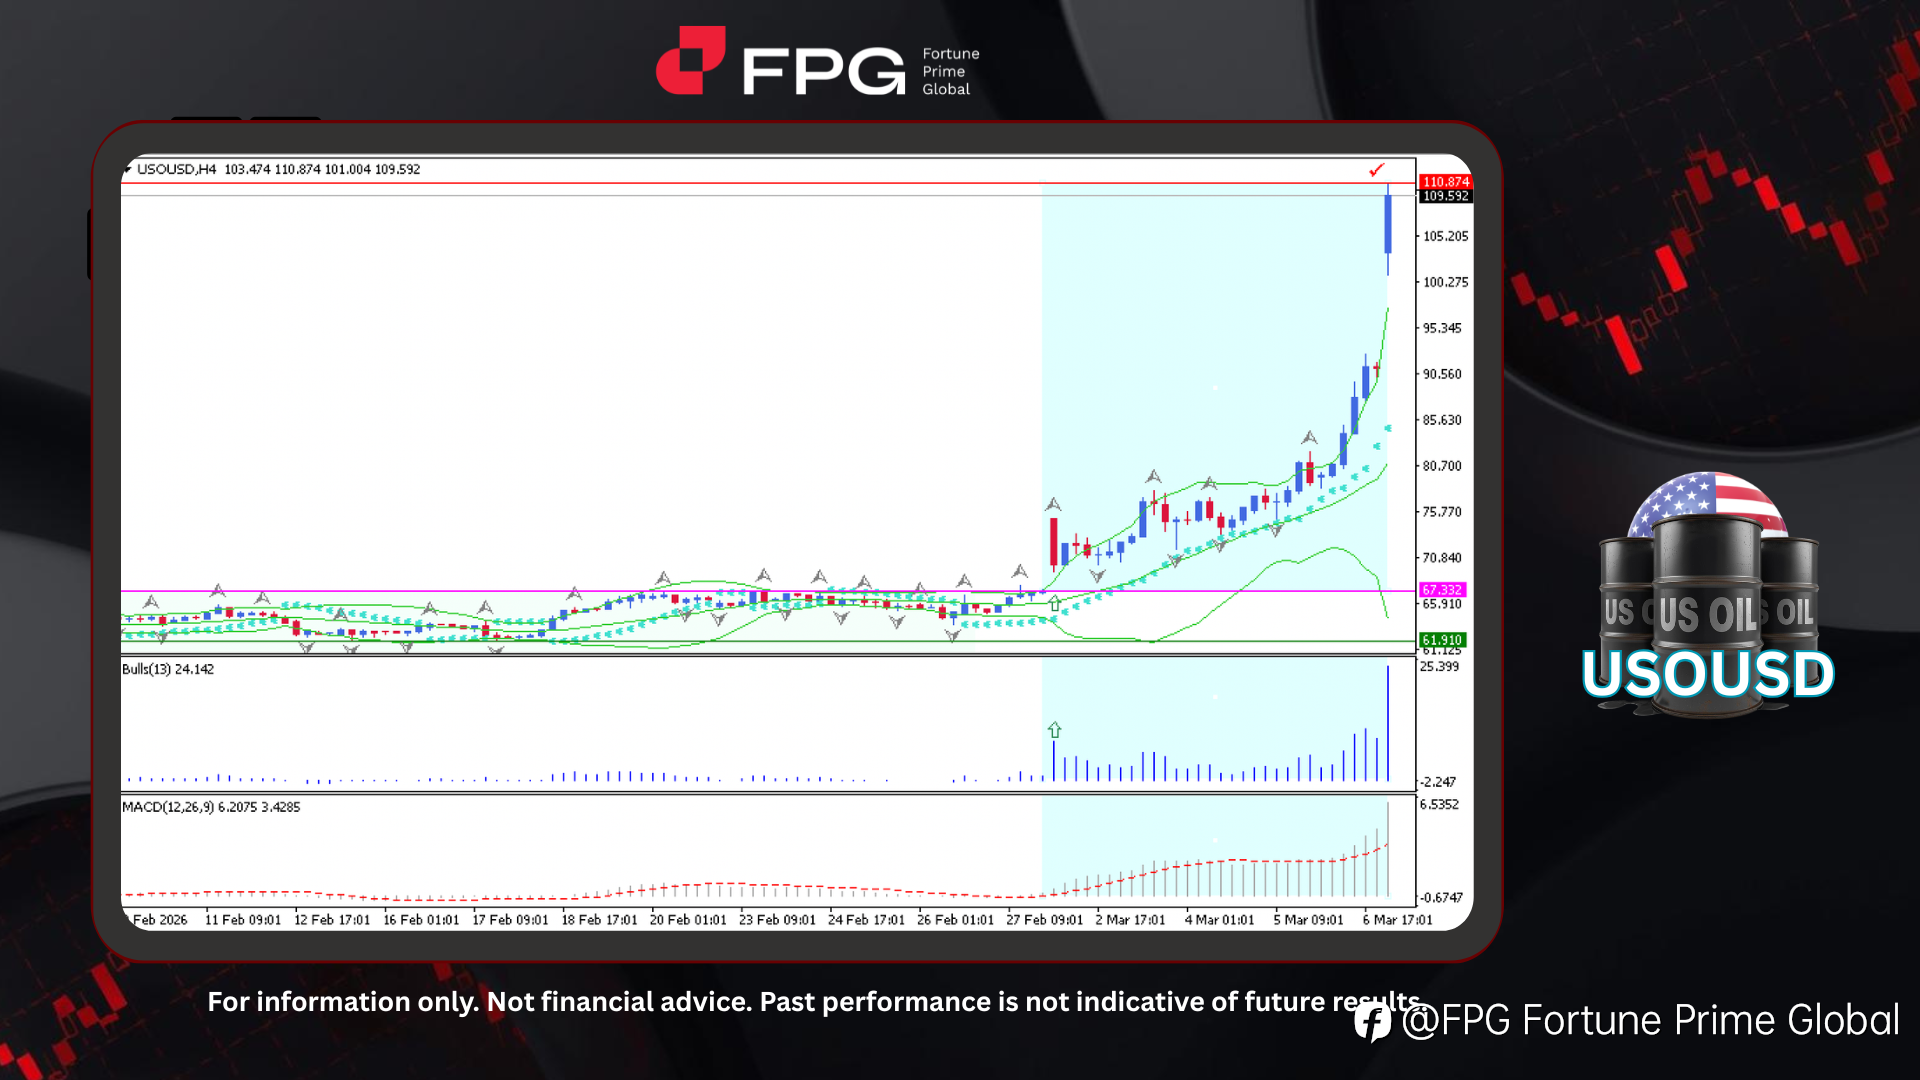
FPG USOUSD Market Report March 9, 2026
On the H4 timeframe chart, USOUSD (US Oil) shows a strong bullish breakout after the price had previously remained very stable for weeks (or even months when viewed on a broader chart with a higher timeframe). Price broke above the 67.33 resistance and surged sharply, reaching a high of 110.87 withi
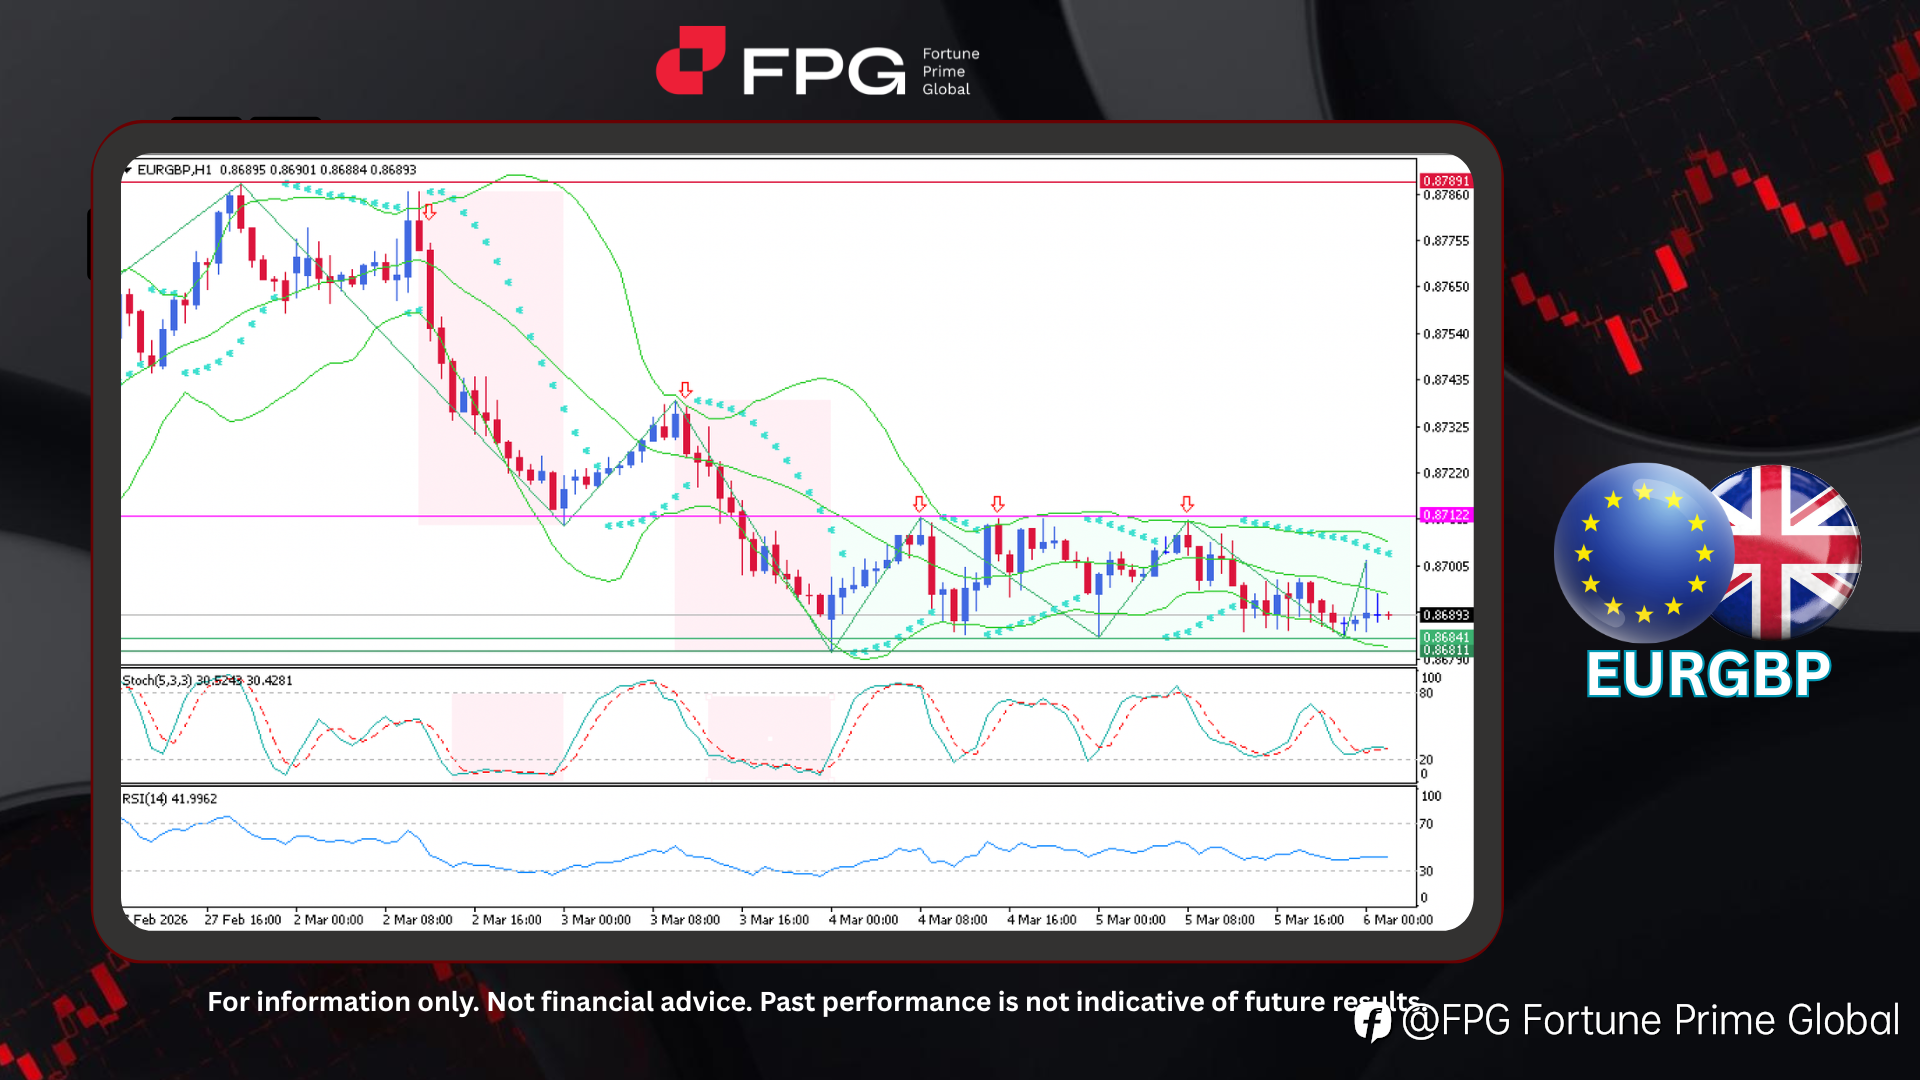
FPG EURGBP Market Report March 6, 2026
On the H1 timeframe chart, EURGBP showed two notable price declines in early March. Measuring the overall move, the rally dropped from 0.8786 to 0.8681. After this decline, price action stabilized and began forming a sideways channel, indicating a period of consolidation. The pair is currently tradi
FPG USOUSD Market Report March 5, 2026
On the H4 timeframe chart, USOUSD (US Oil) previously moved within a relatively stable sideways channel for several weeks before a strong fundamental catalyst triggered a breakout above the upper boundary at 67.33. This breakout initiated a sharp bullish rally that pushed the price toward the 78.04