
· Views 90
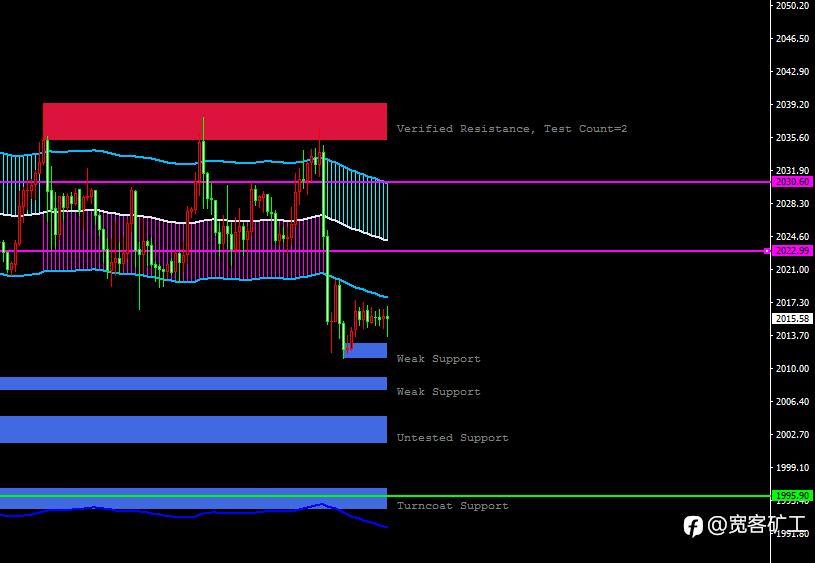
黄金小时图结构
黄金日线昨天收出实体大阴线,小时图呈现先涨后跌的轨迹,在2019多单防守位置之下亚欧盘高点再次测试2035附近,随后受数据影响连续收阴跌破小时图多单防守位置,2030位置再次转为空单的防守位,日内也受空头轨道线的压制,防守2023,日内以2023-2030为空单防守区域先介入短空
操作上,2020做空,止损2030,止盈2010、2000
2018做空,止损2023,止盈2013、2007
2007短多,止损2004,止盈2013、2018
2002做多,止损1997,止盈2007、2012
Disclaimer: The content above represents only the views of the author or guest. It does not represent any views or positions of FOLLOWME and does not mean that FOLLOWME agrees with its statement or description, nor does it constitute any investment advice. For all actions taken by visitors based on information provided by the FOLLOWME community, the community does not assume any form of liability unless otherwise expressly promised in writing.
FOLLOWME Trading Community Website: https://www.followme.com


Hot
No comment on record. Start new comment.