
· Views 109
Spot Gold is down on Tuesday, piercing the $2,000 key psychological support during the US session. Market players continued buying the US Dollar after Wall Street’s opening and following a string of United States (US) data.
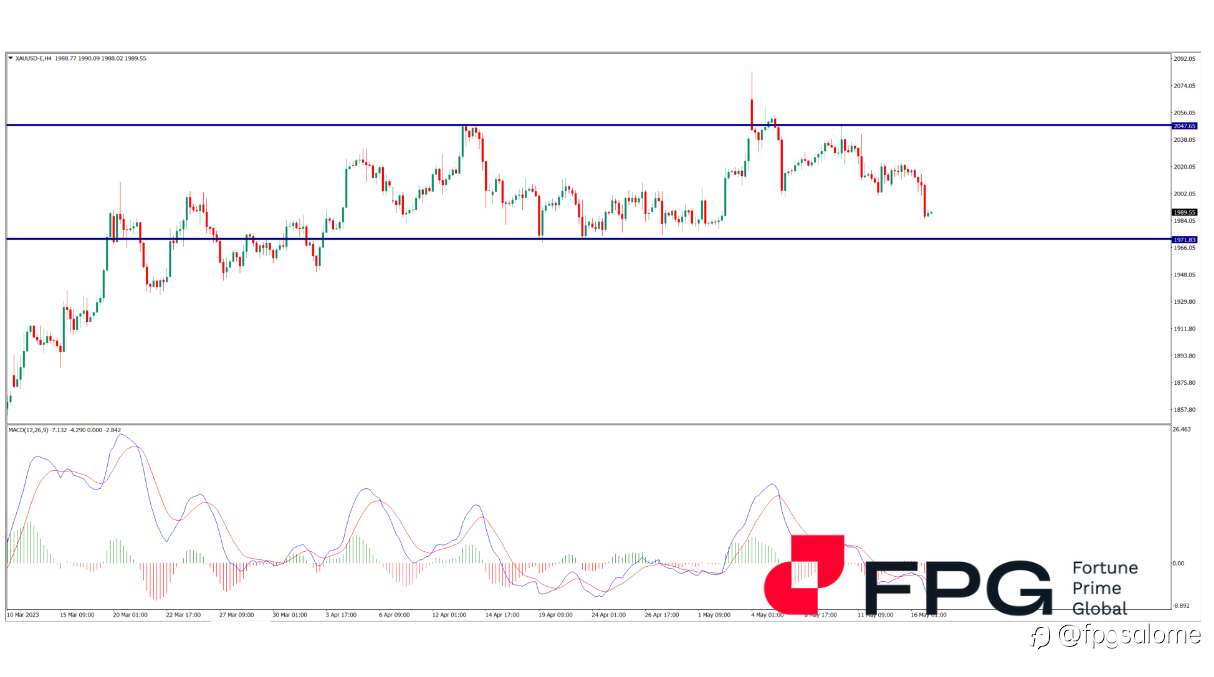
As we can see on daily chart, Gold fell by almost 30$ to 1989$ this morning and entering into another support at 1971$. Last time Gold traded below 1971 was back in April 2023.
On 4hr chart, we can see Gold has been trading within the 70$ range since Early April until today. Traders are all waiting to see how Gold reacts when it gets closer to the 1971$ mark.
if it breaks 1971$, it will open up another downward 20$ space. Lets follow up in the following days!.

Disclaimer: The content above represents only the views of the author or guest. It does not represent any views or positions of FOLLOWME and does not mean that FOLLOWME agrees with its statement or description, nor does it constitute any investment advice. For all actions taken by visitors based on information provided by the FOLLOWME community, the community does not assume any form of liability unless otherwise expressly promised in writing.
FOLLOWME Trading Community Website: https://www.followme.com


Hot
No comment on record. Start new comment.