
· Views 288
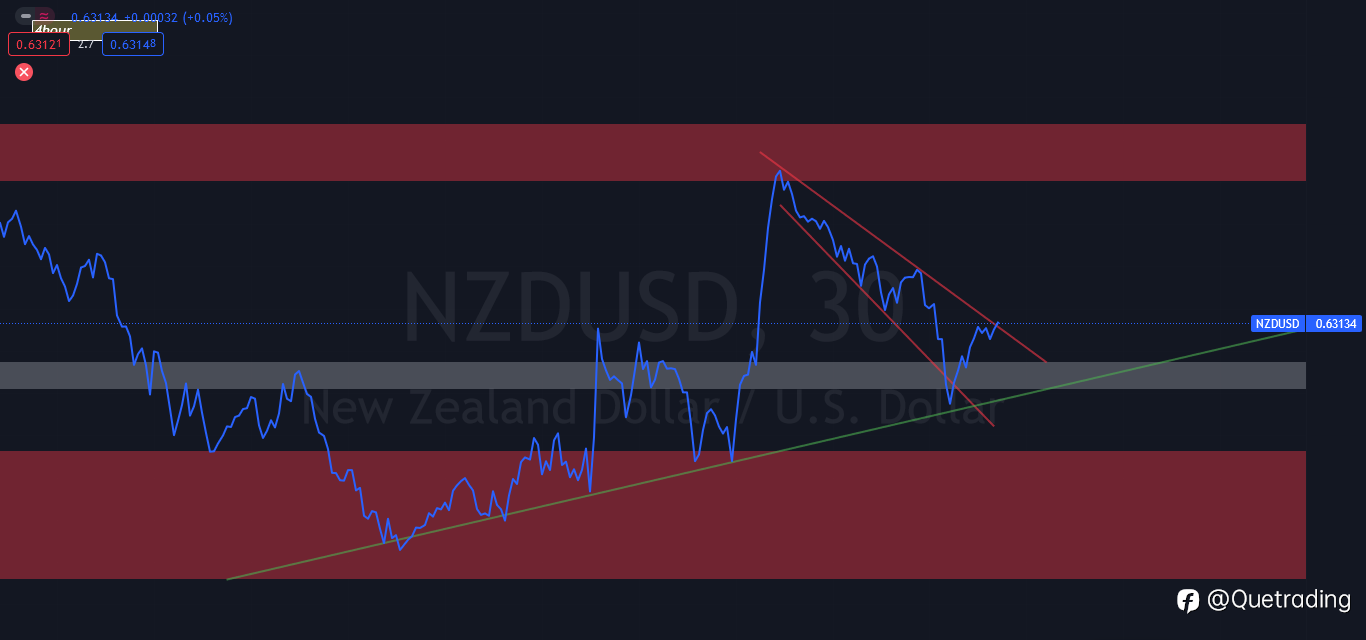
NZDUSD Line chart view of the 30 minute time-frame
Trend-lines are bull and bear color coded.
Red rectangles are higher time-frame areas
White rectangles is the 4 hour on down.
Disclaimer: The content above represents only the views of the author or guest. It does not represent any views or positions of FOLLOWME and does not mean that FOLLOWME agrees with its statement or description, nor does it constitute any investment advice. For all actions taken by visitors based on information provided by the FOLLOWME community, the community does not assume any form of liability unless otherwise expressly promised in writing.
FOLLOWME Trading Community Website: https://www.followme.com


Hot
No comment on record. Start new comment.