
Analisis Tren (Fig. 1).
Pasangan mata uang EUR/USD bisa bergerak naik dari level 1,0925 (menutup candle harian kemarin) dan akan menguji level pullback 61,8% di 1,0969 (garis putus-putus merah). Setelah itu, pergerakan naik yang berlanjut memungkinkan bagi fraktal atas di 1,0981 (garis putus-putus biru).
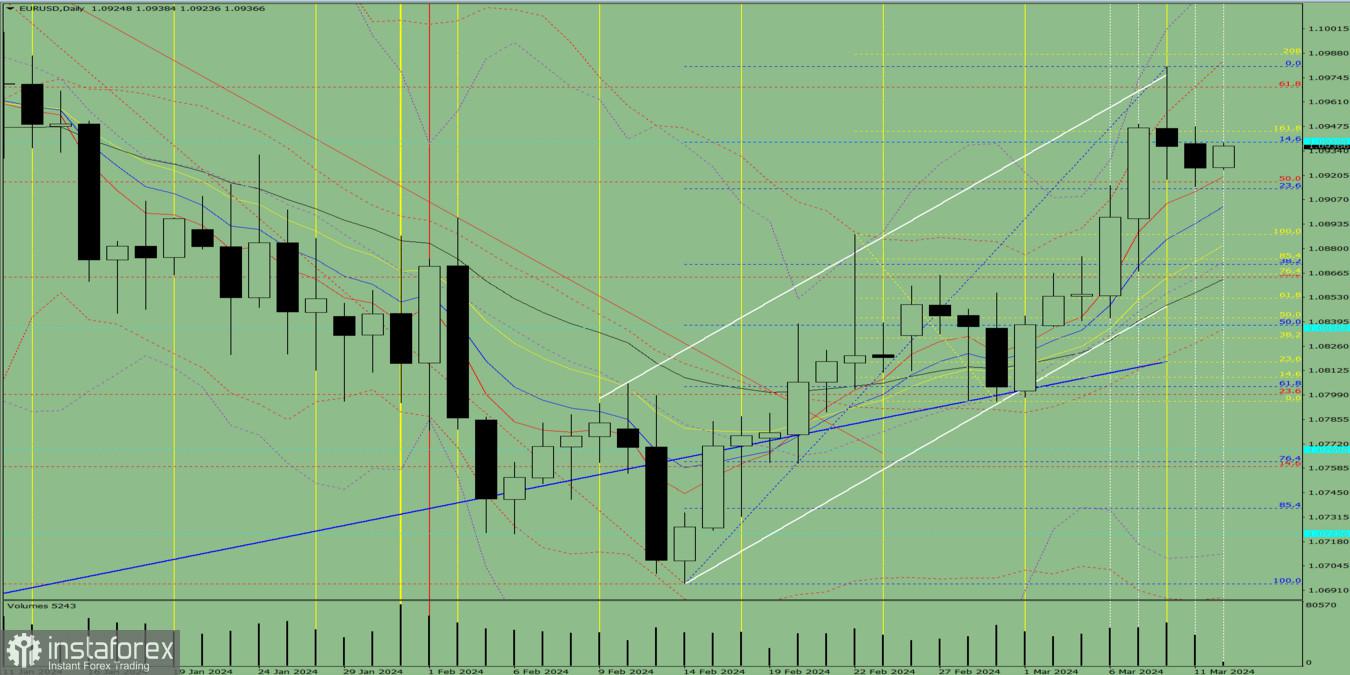
Fig. 1 (grafik harian).
Analisis keseluruhan:
- Analisis indikator – naik;
- Volume – naik;
- Analisis Candlestick – turun;
- Analisis tren – naik;
- Bollinger band – naik;
- Grafik mingguan – naik.
Kesimpulan Umum: Hari ini, harga bisa bergerak naik dari level 1,0925 (menutup candle harian kemarin) dan akan menguji level pullback 61,8% di 1,0969 (garis putus-putus merah). Setelah itu, pergerakan naik yang berlanjut memungkinkan bagi fraktal atas di 1,0981 (garis putus-putus biru).ntinued upward movement is possible to the upper fractal at 1.0981 (blue dotted line).
Secara alternatif, dari level 1,0925 (menutup candle harian kemarin), harga bisa bergerak dan akan menguji level pullback 61,8% di 1,0969 (garis putus-putus merah). Setelah itu, harga-harga bisa bergerak turun.


Hot
No comment on record. Start new comment.