技术分析 – NZDUSD处于矩形模式

- NZDUSD触及500日SMA后下跌
- 但在200日SMA获强劲支撑
- 震荡指标维持在看跌区间
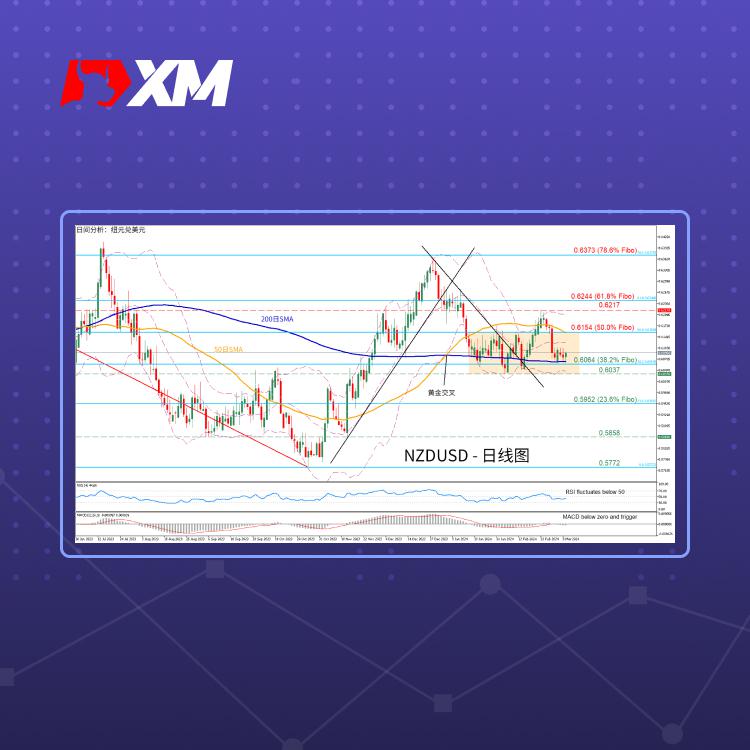
NZDUSD在斐波那契回调线78.6%位置的价格0.6373(对应图中0.6536-0.5772)遇阻后一直处于下行趋势。尽管该货币对尝试复苏并暂时突破50日移动平均线(SMA),但反转下跌后目前转为短期区间震荡。
鉴于相对强弱指数(RSI)和异同移动平均线(MACD)指标倾向下行,汇价或跌破200日移动平均线(SMA)并测试斐波那契38.2%位置的价格0.6064。跌破此处,2024年低点0.6037或可提供支撑。进一步下行,或测试斐波那契23.6%位置的价格0.5952。
反之,若汇价反转上涨,或会在斐波那契50.0%位置的价格0.6154遇阻,即与50日移动平均线(SMA)重叠之处。突破此处,或挑战前期高点0.6217。进一步上涨,或会在斐波那契61.8%位置的价格0.6244遇阻。
综上所述,尽管突破50日移动平均线(SMA),但NZDUSD反转下行在200日简单移动平均线(SMA)获得强劲支撑后,目前转为区间震荡趋势。因此,若简单移动平均线(SMA)提供强劲支撑,该货币对将持续区间震荡。
Reprinted from XM,the copyright all reserved by the original author.
Disclaimer: The content above represents only the views of the author or guest. It does not represent any views or positions of FOLLOWME and does not mean that FOLLOWME agrees with its statement or description, nor does it constitute any investment advice. For all actions taken by visitors based on information provided by the FOLLOWME community, the community does not assume any form of liability unless otherwise expressly promised in writing.
FOLLOWME Trading Community Website: https://www.followme.com


Hot
-THE END-