
Analisis tren (Gbr. 1).
Pasangan mata uang EUR/USD dapat bergerak naik dari level 1.0838 (penutupan candlestick harian Jumat) ke 1.0864, level kemunduran 38.2% (garis putus-putus merah). Dalam kasus pengujian level ini, pergerakan turun mungkin terjadi ke 1.0842, level pullback 76.4% (garis putus-putus biru).
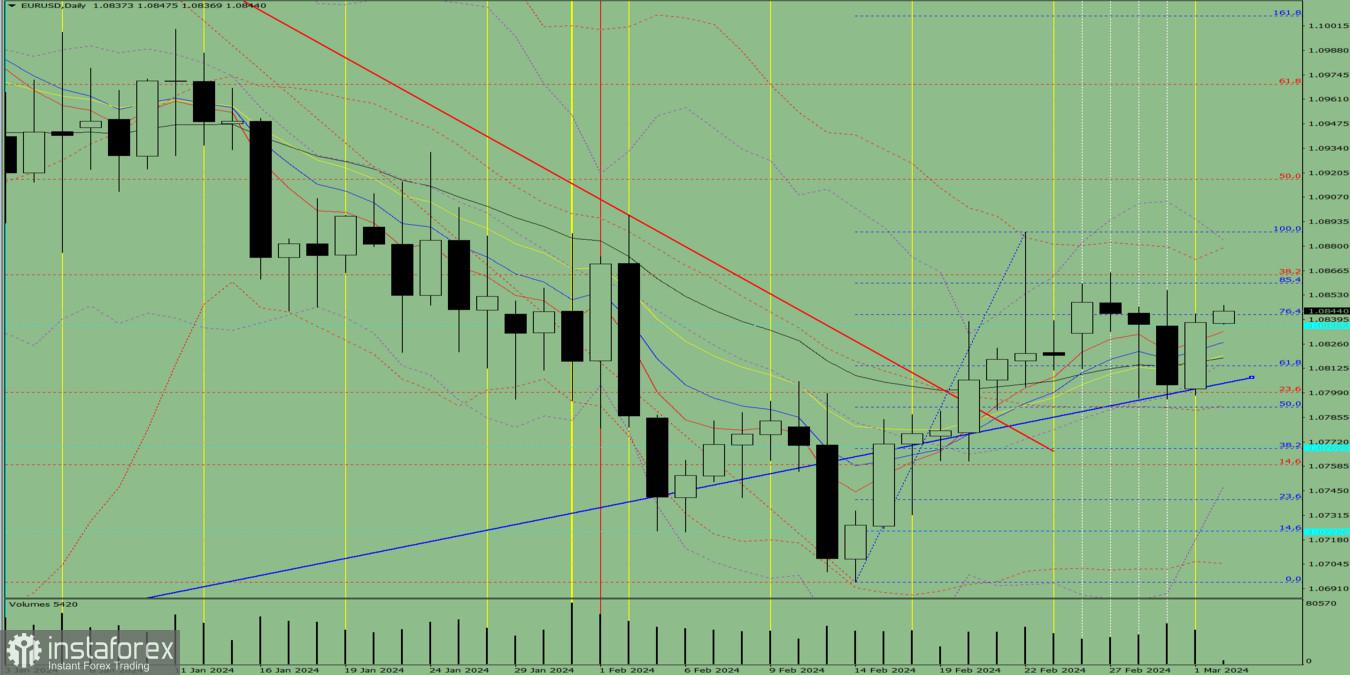
Gbr. 1 (grafik harian).
Analisis komprehensif:
- Analisis indikator - naik;
- Level-level Fibonacci - naik;
- Volume - naik;
- Analisis kandil - naik;
- Analisis tren - naik;
- Bollinger bands - naik;
- Grafik mingguan - naik.
Hari ini, harga dapat bergerak naik dari level 1.0838 (penutupan candlestick harian Jumat) ke 1.0864, level pullback 38.2% (garis putus-putus merah). Jika level ini teruji, pergerakan turun mungkin terjadi ke 1.0842, level pullback 76.4% (garis putus-putus biru).
Sebagai alternatif, dari level 1.0838 (penutupan candlestick harian Jumat), harga dapat bergerak naik ke 1.0864, level kemunduran 38.2% (garis putus-putus merah). Jika level ini teruji, maka pergerakan naik lanjutan mungkin terjadi ke fraktal atas di 1.0888 (garis putus-putus biru).


Hot
No comment on record. Start new comment.