
Analisis Tren (Fig. 1).
Pasangan mata uang GBP/USD bisa bergerak turun dari level 1,2680 (menutup candle harian kemarin) ke level pullback 50% di 1,2644 (garis putus-putus biru). Jika ada pengujian level ini, sebuah pergerakan naik memungkinkan ke level pullback 61,8% di 1,2708 (garis putus-putus kuning).
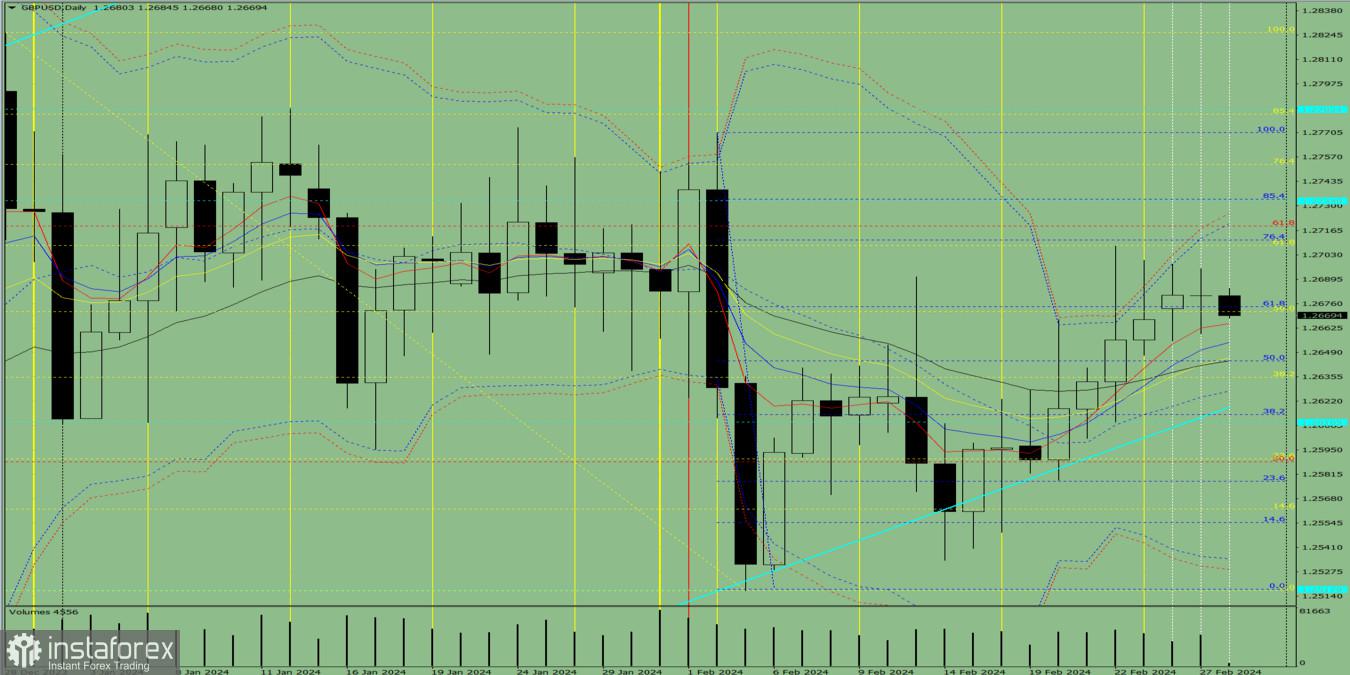
Fig. 1 (grafik harian).
Analisis Keseluruhan:
- Analisis indikator – turun;
- Level Fibonacci – turun;
- Volume – turun;
- Analisis Candlestick – turun;
- Analisis tren – naik;
- Grafik mingguan – naik;
- Bollinger bands – turun.
Kesimpulan Umum: Hari ini harga bisa bergerak turun dari level 1,2680 (menutup candle harian kemarin) ke level pullback 50% di 1,2644 (garis putus-putus biru). Jika ada pengujian level ini, sebuah pergerakan naik memungkinkan ke level pullback 61,8% di 1,2708 (garis putus-putus kuning).
Secara alternatif, dari level 1,2680, harga-harga bisa terus bergerak turun ke 1,2655, EMA 8 periode (garis tipis biru). Jika ada pengujian level ini, pergerakan naik memungkinkan ke level pullback 61,8% di 1,2708 (garis putus-putus kuning).


Hot
No comment on record. Start new comment.