
Analysis of EUR/USD 5M
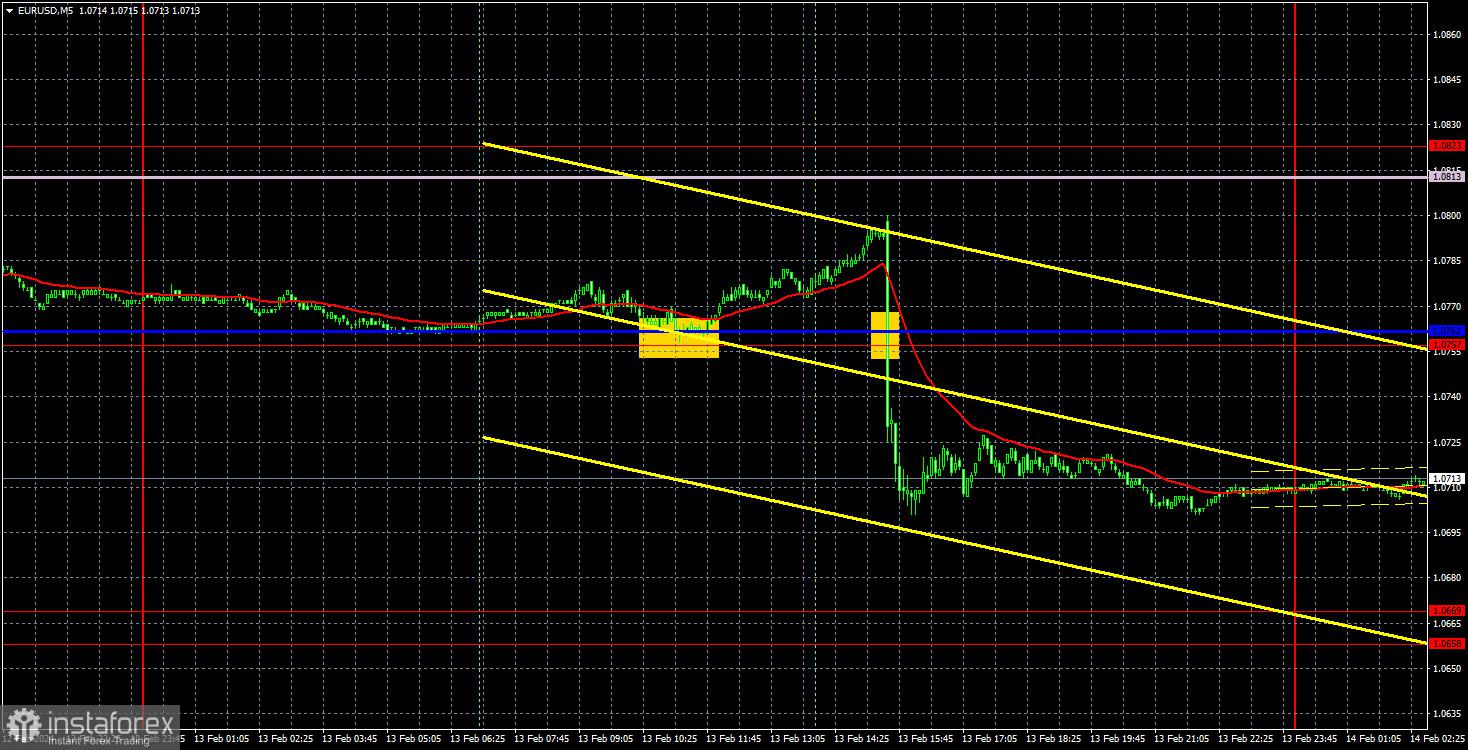
EUR/USD resumed its downward movement on Tuesday. The main movement of the day occurred within 5-10 minutes when the U.S. inflation report was published. The Consumer Price Index for January disappointed dollar sellers, as inflation did not slow down as much as expected. The annual rate of inflation dropped less than expected to 3.1% in January, which, in principle, corresponds to forecasts (2.9-3.1%), and economists had forecast January's core CPI rate would slow to 3.7% year over year, but it remained at 3.9%. Such information provoked the dollar's rise, which, from our perspective, is entirely justified.
In general, the euro continues to decline. For several consecutive months, we have been listing factors that suggest why the euro should fall. At the moment, there are no questions or doubts about the market. The European economy is weaker, the euro is overbought, expectations for a European Central Bank rate cut are getting weaker, while expectations for a Federal Reserve rate cut are getting stronger. Therefore, the dollar has an undeniable advantage.
On the hourly chart, it is clear that the pair failed to reach the Senkou Span B line and settled below the critical line. Therefore, the downtrend remains intact from a technical perspective, albeit a rather slow one. However, the euro has never been a volatile instrument. Therefore, downward movements are normal for EUR/USD.
Only two trading signals were generated yesterday. During the European session, the price bounced off the critical line and managed to rise by about 25 pips before the inflation report was released. Before the report, it was advisable to either close these positions with a profit or set the Stop Loss at breakeven. The sell signal formed around the Kijun-sen line and the level of 1.0757 was challenging to execute as the pair dropped by 67 pips in 5 minutes. Nevertheless, it was possible to enter the market with the help of a pending sell order. This trade also turned out to be profitable – as traders could earn around 25-30 pips.
COT report:
The latest COT report is dated February 6. The net position of non-commercial traders has been bullish for quite some time. The number of long positions is much higher than the number of short positions. However, in recent weeks, the number of longs has been decreasing, while the number of shorts is rising, which aligns with the euro's current movement and our expectations.
We believe that the euro should fall and the uptrend must end. During the last reporting week, the number of long positions for the non-commercial group increased by 2,000, while the number of short positions increased by 28,800. Accordingly, the net position fell by 16,600. The number of buy contracts is still higher than the number of sell contracts among non-commercial traders by 62,000. The gap is quite large, but we're starting to see a noticeable change. Even without COT reports, it is clear that the euro should fall further.
Analysis of EUR/USD 1H
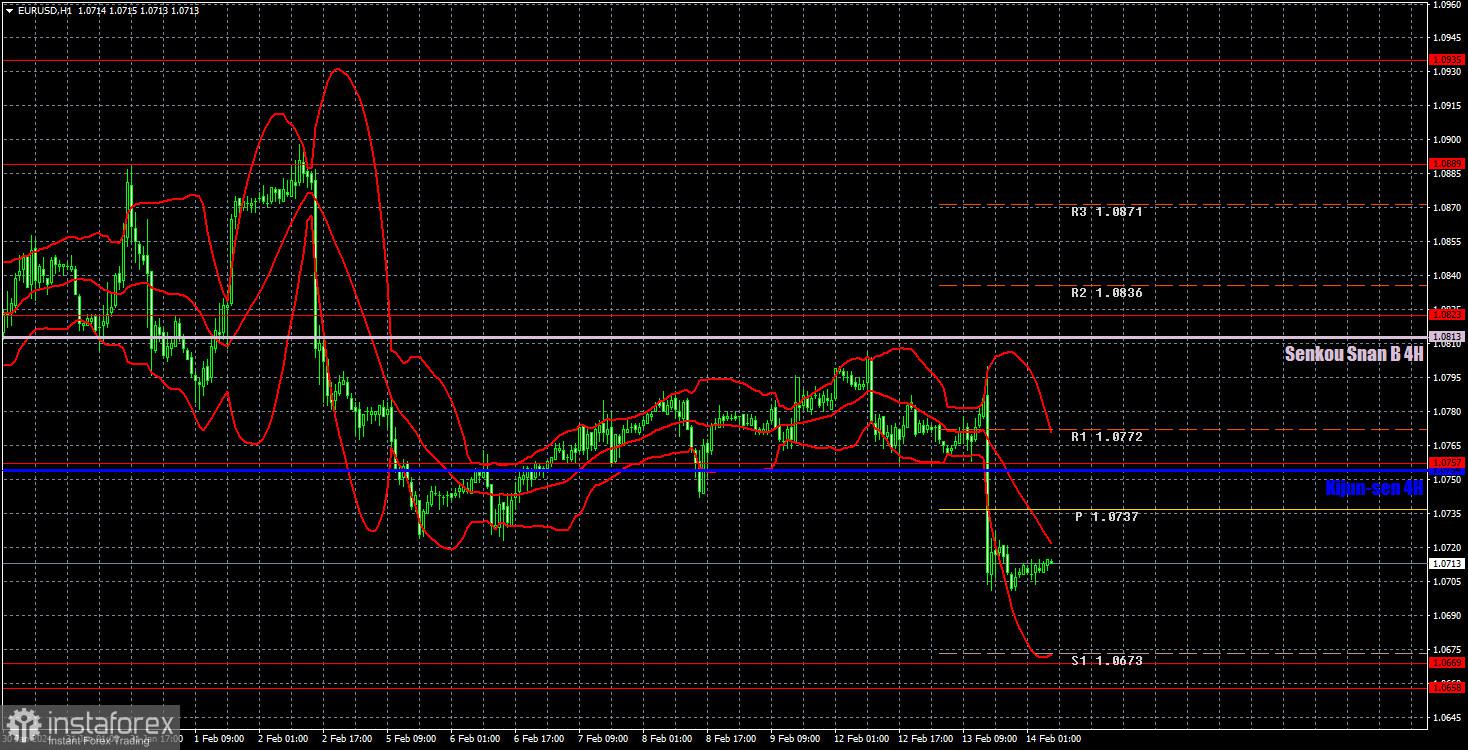
On the 1-hour chart, the downtrend persists. In our opinion, nearly all the factors currently suggest that the dollar will strengthen. Yesterday, the inflation report supported the US currency, but it's worth noting that this is not the first report or event that has been supportive of the dollar. In general, the fundamental background is currently in favor of the US currency. Therefore, we expect the euro to fall. The nearest target is the 1.0658-1.0669 area.
On February 14, we highlight the following levels for trading: 1.0530, 1.0581, 1.0658-1.0669, 1.0757, 1.0823, 1.0889, 1.0935, 1.1006, 1.1092, as well as the Senkou Span B line (1.0813) and Kijun-sen (1.0754). The Ichimoku indicator lines can move during the day, so this should be taken into account when identifying trading signals. Don't forget to set a breakeven Stop Loss if the price has moved in the intended direction by 15 pips. This will protect you against potential losses if the signal turns out to be false.
On Wednesday, the EU will release "conditionally important" reports on industrial production and Q4 GDP. This will be the second estimate of the GDP report, which is objectively much less important than the first or third. In any case, it is quite difficult to expect positive values from European GDP, or growth in industrial output. Therefore, such reports are unlikely to provide support for buyers. The US event calendar is empty today.
Description of the chart:
Support and resistance levels are thick red lines near which the trend may end. They do not provide trading signals;
The Kijun-sen and Senkou Span B lines are the lines of the Ichimoku indicator, plotted to the 1H timeframe from the 4H one. They provide trading signals;
Extreme levels are thin red lines from which the price bounced earlier. They provide trading signals;
Yellow lines are trend lines, trend channels, and any other technical patterns;
Indicator 1 on the COT charts is the net position size for each category of traders;
Indicator 2 on the COT charts is the net position size for the Non-commercial group.


Hot
No comment on record. Start new comment.