
Ethereum's Ascent Towards $3,000: A Technical Perspective
Key Takeaways
- Ethereum shows a bullish trend with potential towards $3,000.
- Key support levels and channel patterns are crucial for trend analysis.
- Market sentiment leans strongly bullish, with caution due to overbought conditions.

Technical Market Outlook:
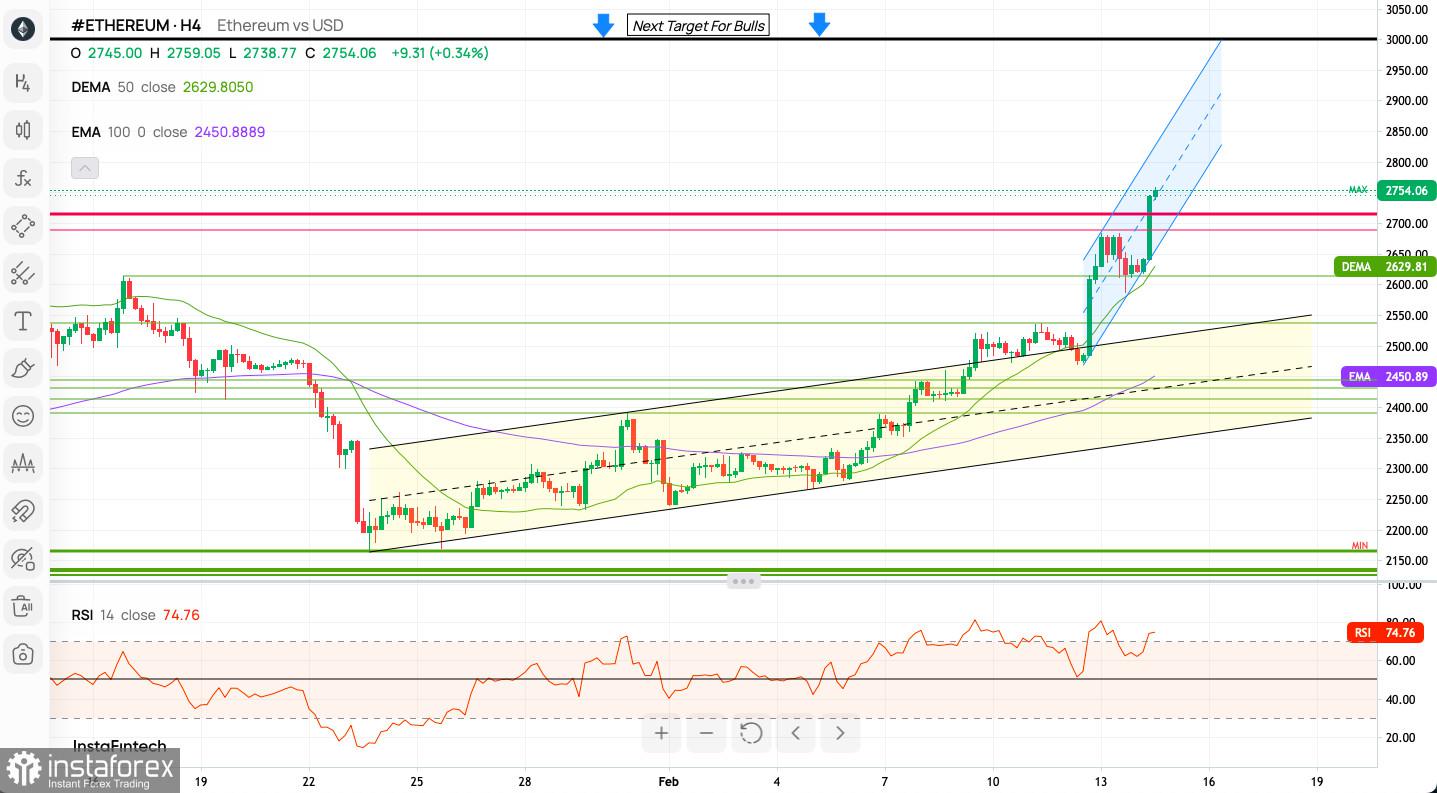
Ethereum (ETH) has recently reached a high of $2,759. Currently, it is consolidating gains, staying close to its last high on the H4 chart. The break above the supply zone turns $2,714 and $2,690 into key support levels. The strong and positive momentum in the H4 timeframe indicates a short-term bullish trend. However, traders should note the market is currently in an overbought state.
Channel Pattern and Market Outlook
ETH/USD trades within an ascending blue channel. This pattern suggests a bullish outlook, potentially leading to a parabolic increase as long as the price remains within the channel.
The Key Levels To Watch:
- Upper Channel Line Resistance: Since ETH is trading near the upper boundary of the ascending channel, this line acts as an immediate resistance level. The precise value might fluctuate slightly as the channel is upward sloping, but it would be around the current price or slightly above.
- Bullish Target Resistance: The chart indicates the next target for bulls is around $2800, which is a crucial psychological and technical resistance level to watch.
- DEMA 50 Support: The DEMA (Double Exponential Moving Average) 50 is sitting just below the current price action around $2629. This level may act as immediate support.
- EMA 100 Support: The EMA (Exponential Moving Average) 100 is another key support level, currently near $2450. If the price were to retrace, this could be an area where buyers step in.
- Lower Channel Line Support: The bottom line of the ascending channel will be a key support level. A break below this could signify a change in the short-term trend.
- Overbought RSI Level: While not a price level, the RSI is in the overbought territory, which could indicate potential for a pullback. If the RSI starts to decline, it may coincide with the price reaching resistance or falling to a support level.
- Previous Highs and Lows: Any recent swing highs and lows within the channel will also act as reference points for support and resistance.
Indicator Insights
- All 23 technical indicators on the 1H timeframe show a Buy signal.
- The 18 moving averages also support a Buy signal.
Market Sentiment Overview
- The sentiment is overwhelmingly bullish (75% bulls). This sentiment has grown even stronger over the past week (78% bulls) and in the last three days (81% bulls).
Weekly Pivot Points
Pivot Points are crucial for identifying potential reversals, support, and resistance levels. For ETH, these include:
- WR3 at $2,586
- WR2 at $2,542
- WR1 at $2,519
- Weekly Pivot at $2,499
- WS1 at $2,476
- WS2 at $2,455
- WS3 at $2,412
Trading Scenarios: Bullish and Bearish Outlook
Bullish Scenario
- If ETH maintains its trajectory within the ascending channel and breaks past recent highs, it could continue its upward trend towards the $3,000 mark.
- Strong buying signals from technical indicators support this bullish potential.
Bearish Scenario
- A break below the ascending channel or key support levels might signal a trend reversal.
- Overbought market conditions could lead to a pullback or consolidation phase.
Useful Links
- More Artcles
- InstaForex Course for Beginners
- Open Trading Account
Important Notice
The begginers in forex trading need to be very careful when making decisions about entering the market. Before the release of important reports, it is best to stay out of the market to avoid being caught in sharp market fluctuations due to increased volatility. If you decide to trade during the news release, then always place stop orders to minimize losses.
Without placing stop orders, you can very quickly lose your entire deposit, especially if you do not use money management and trade large volumes. For successful trading, you need to have a clear trading plan and stay focues and disciplined. Spontaneous trading decision based on the current market situation is an inherently losing strategy for a scalper or daytrader.
#instaforex #analysis #sebastianseliga


Hot
No comment on record. Start new comment.